 Marina Lyubimova

⬤ Bitcoin just broke below its 100-week moving average on the weekly chart—a technical signal that traders watch closely. Right now, that level sits around $87,400, and BTC is trading underneath it. This kind of breakdown hasn't happened since the 2022 bear market, and it's raising some serious questions about where the price goes from here.
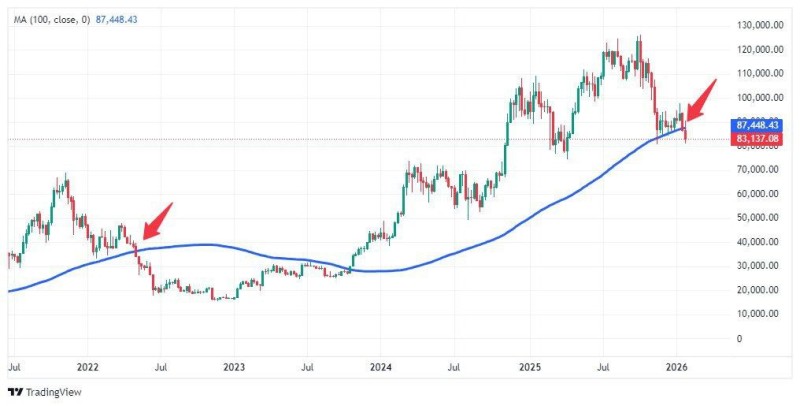
⬤ Looking back at 2022, when Bitcoin fell below this same moving average, it basically confirmed the bear market was real. What used to act as support turned into resistance, and the price struggled for months. The current chart setup looks eerily similar. Bitcoin is fighting to stay above that line and failing, which gives this technical level even more weight.
⬤ There's still a chance for recovery, but it's going to take a strong move. Bitcoin needs to close a full week above $88,000 to flip the script and prove the bulls are back in control. Until that happens, the downside risk is very real. History shows that when Bitcoin trades below this average for a while, things tend to get shaky—more volatility, weaker sentiment, the works.
⬤ This matters beyond just Bitcoin's chart. The 100-week moving average has been a reliable long-term trend indicator for years. When it breaks, it affects how traders position themselves and how much risk people are willing to take across the entire crypto market. Whether Bitcoin can climb back above this level or keeps sliding lower will likely set the tone for the next few weeks.
 Marina Lyubimova


