Saad Ullah

For almost two years, Bitcoin has respected a powerful rising trendline, bouncing back each time it touched this support and keeping the bullish momentum alive. But as October 2025 wraps up, BTC has returned to this make-or-break level once again. The chart shows repeated successful tests of this diagonal line—but this latest retest looks shakier, hinting that momentum may be fading as global liquidity tightens and investor enthusiasm cools.
Chart Analysis: The Critical Support Line
The chart shared by Ali (BTC/USDT on Binance, 3-day timeframe) reveals an ascending trendline connecting four major higher lows since mid-2023:
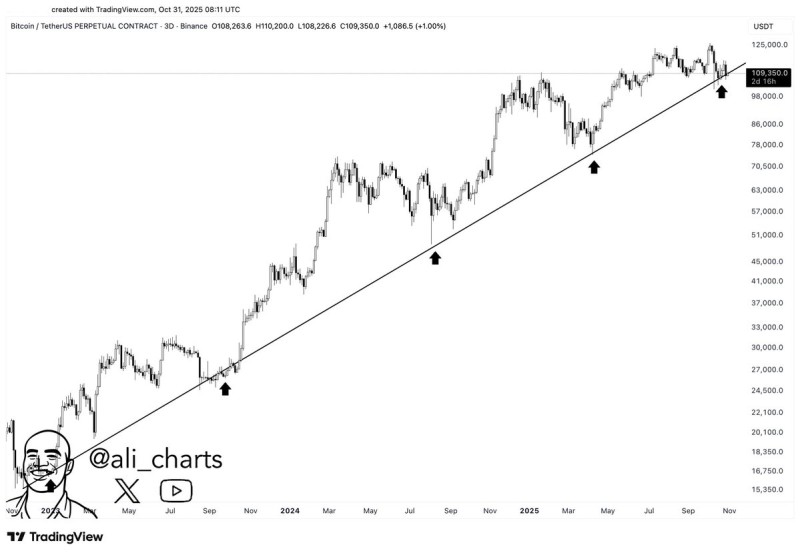
- Mid-2023: Rally launch after months of sideways action
- Late 2023: Strong bounce from a local dip
- Mid-2024: Sharp recovery confirming the line as reliable support
- Early 2025: Push toward all-time highs
- October 2025 (now): Fifth test of the same trendline
Each previous touch sparked a strong rebound, but this time the price action looks weaker—suggesting the structure might be losing steam. A break below would likely flip sentiment from bullish confidence to cautious.
Bitcoin is currently trading near $109,350, sitting right on that critical support.
If the trendline holds: The next resistance zone sits between $120,000–$125,000, and Bitcoin could repeat its pattern of bouncing back up the channel.
If it breaks: A confirmed drop below $108,000 opens the door to $98,000 (nearest structural support) and potentially $86,000 as the next major level. The thinner candlestick structure suggests reduced buying pressure and growing vulnerability.
Macro Backdrop: Tightening Conditions
Bitcoin's technical pressure comes alongside tougher macro conditions. Global liquidity is tighter, real rates remain elevated, and institutional crypto inflows have slowed. The uptrend is still intact, but the explosive momentum from earlier in the cycle has cooled. Volatility has also compressed—a setup that often precedes a big move in either direction.
Bitcoin's two-year bull structure is at a crossroads. The rising support that's guided every rally since 2023 is being tested again—but unlike before, this retest shows weaker buying and growing uncertainty.
Whether that thread holds or snaps will set the tone for the rest of 2025. If the trendline survives, expect another powerful bounce. If not, a pullback toward the mid-$90,000s could be on the table—resetting the stage for the next leg up.
 Saad Ullah