 Saad Ullah

⬤ Bitcoin now trades close to multiple price levels that show what different groups of investors paid for their coins. Glassnode's latest numbers list the exact prices the market is testing - the chart compares Bitcoin's live price with the average prices those groups actually paid. Traders use those comparisons to see where mood might change.
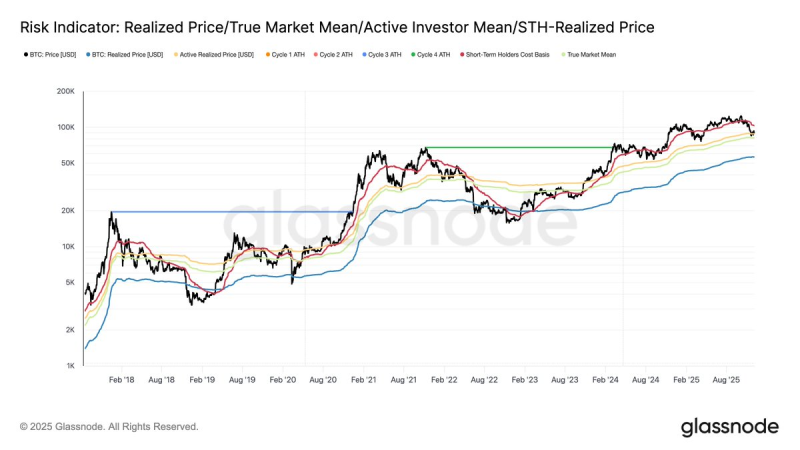
⬤ Bitcoin's live price is about $89,200 - that is only $1,200 above the Active Investor Mean of $88,000. When price hovers near that mean, short term moves often start to sway the wider market. The Short-Term Holders Cost Basis stands at $103,100; recent buyers still hold paper profit - yet they tend to sell quickly if volatility rises. The True Market Mean sits at $81,400 and the Realized Price at $56,400. Those two deeper levels show where long term owners step in - every past cycle has respected those floors.
When BTC trades close to those cost levels, sentiment flips fast once price either stays above or drops below.
⬤ Glassnode's chart tracks how Bitcoin acts whenever market price nears those layered cost curves. Price above the short term cost level normally points to rising momentum and rising optimism - it also marks a zone where risk stacks up if the uptrend fades. Across earlier cycles, price has respected or lost those same lines at both rallies and corrections.
⬤ Those patterns matter because they reveal how risk moves from one investor group to another as Bitcoin travels through its cycle. With BTC now sitting next to multiple of those benchmarks, the market's next step will likely steer momentum and shape behaviour for short term traders and for long term holders alike.
 Saad Ullah


