 Usman Salis

Binance Coin (BNB) just can't catch a break, dropping another 1.37% in the last 24 hours. With the selling pressure mounting, traders are wondering when this downtrend might finally run out of steam.
BNB's Support Levels Are Starting to Crack
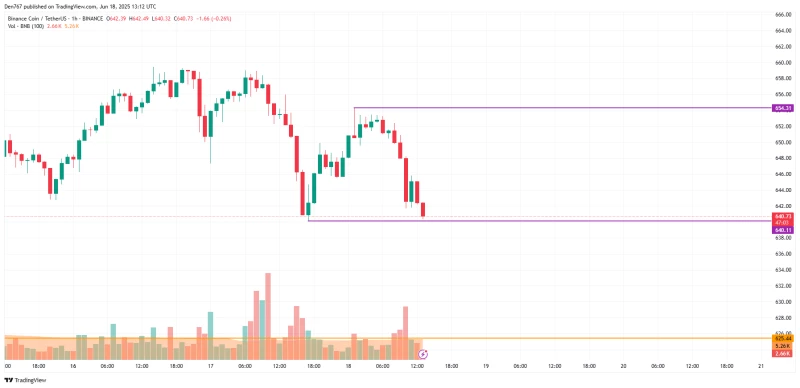
Things aren't looking great for Binance Coin (BNB) right now. If you peek at the hourly chart, you'll see the price is getting dangerously close to that key support at $640.11. This isn't just some random number on a chart – it's been holding the line for a while now, and if it breaks, we could be in for more pain.
Here's the thing: if BNB can't hold above $640.11 and we see a daily close below that level, the next stop is likely around $635. That might not sound like a huge drop, but in crypto, these moves can happen fast and catch people off guard. When support levels start falling like dominoes, it usually means the bears are running the show.
The bigger picture doesn't look much better either. Looking at longer timeframes, the bears seem to have their claws firmly in BNB's back. If that $640 support gives way, there's enough selling momentum built up to potentially push this thing down to the $630 area. That's where things could get really interesting – or really ugly, depending on which side of the trade you're on.
Weekly Charts Show Binance Coin (BNB) Could Test $625 Soon
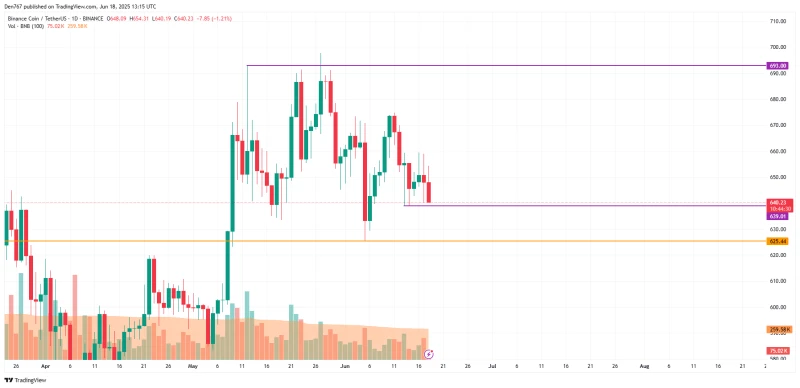
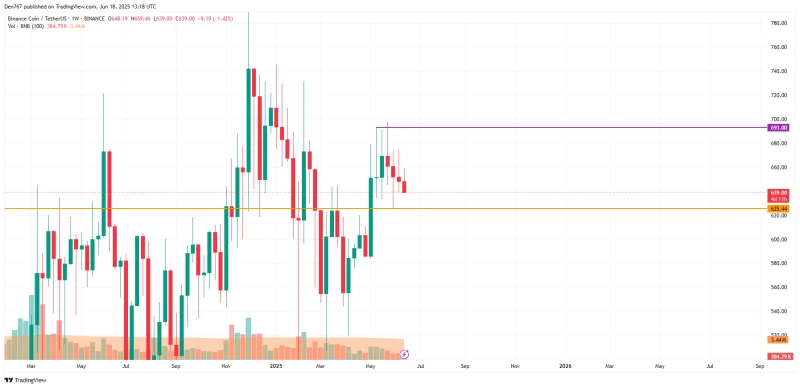
When you zoom out to the weekly view, Binance Coin (BNB) isn't showing any signs of wanting to turn around just yet. There's no magic reversal pattern jumping out at you, no bullish divergence – just more of the same downward pressure we've been seeing.
If this week's candle closes somewhere around where we are now, technical analysts are eyeing a potential test of $625 before June wraps up. That's not exactly the kind of news BNB holders want to hear, but it's what the charts are suggesting right now.
This weekly perspective is crucial because it tells us this isn't just some quick dip that'll bounce back tomorrow. We might be looking at a more sustained move lower, and $625 represents a significant level that could either hold as support or break and open the door to even lower prices.
As of right now, BNB is sitting at $638.70, which puts it right in that danger zone above the key support levels we've been talking about. It's like watching a tightrope walker – one wrong step and down we go.
What's Next for BNB? Key Levels That Matter
The million-dollar question for Binance Coin (BNB) is whether it can hold its ground above that $640.11 support. This is make-or-break time. If sellers manage to push it below that level with conviction, we're probably looking at a trip down to the $630-$635 range pretty quickly.
But here's the flip side – if BNB can somehow find its footing and defend these levels, it might just set up for a decent bounce. The problem is, that would require buyers to actually show up, and right now they seem to be sitting on the sidelines waiting for a better entry point.
Smart money is watching the volume closely here. If BNB breaks down on heavy selling volume, that's a pretty clear signal that more pain is coming. But if the selling is happening on lighter volume, it might suggest that the bears are running out of ammunition.
Don't forget that BNB isn't trading in a vacuum either. What happens with Bitcoin, Ethereum, and the broader crypto market will definitely influence where BNB heads next. Plus, any news coming out of Binance as an exchange – whether good or bad – could throw a wrench into these technical patterns we're watching.
 Usman Salis


