 Usman Salis
Cardano's price action is giving traders serious déjà vu. The cryptocurrency is currently mirroring the exact same technical setup that preceded its explosive rally from $0.05 to over $3 just a few years ago. With ADA sitting at $0.80219 and up 10.36% in the past day, analysts are wondering if history is about to repeat itself.
ADA Price Shows Identical Bull Market Pattern
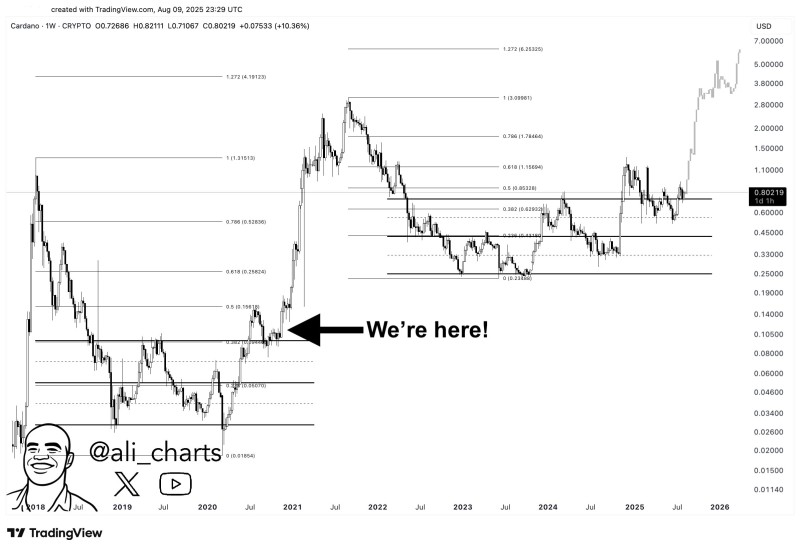
The weekly chart tells a compelling story. Cardano is following the same playbook that led to its previous monster rally, though this time the pace seems more measured. ADA is holding strong above the crucial 0.5 Fibonacci retracement level at $0.853, which acted as a springboard during the last bull cycle.
What makes this setup particularly interesting is how slowly it's developing compared to 2019-2021. Back then, everything moved at breakneck speed. Now, the pattern is unfolding more gradually, which could actually be a good thing for sustained upward momentum.
Analysts Target $4+ for ADA Price
Crypto analyst @ali_charts recently highlighted this "almost identical" market structure on X, noting the uncanny resemblance to Cardano's previous bull run setup. The technical projections are pretty wild if this pattern plays out.
Here's what traders are watching:
- Immediate hurdle: $0.853 (that key Fibonacci level)
- First major target: $1.31
- Moonshot territory: $4.19
These aren't random numbers – they're based on the same Fibonacci extensions that worked during ADA's last major run. Of course, past performance doesn't guarantee future results, but the technical similarities are hard to ignore.
The big question now is whether Cardano can break through that $0.853 resistance cleanly. If it does, we might be looking at the early stages of another significant rally. But traders should keep an eye on Bitcoin's moves too, since ADA typically follows the broader crypto market's lead.
 Usman Salis


