 Alex Dudov
⬤ The U.S. Dollar versus Silver ratio (DXY/XAG) has dropped after hitting long-term resistance and breaking through its rising support trendline. As @GoldPredictors reported, this break of structural support on the monthly chart signals a shift in how the dollar and silver prices relate to each other.
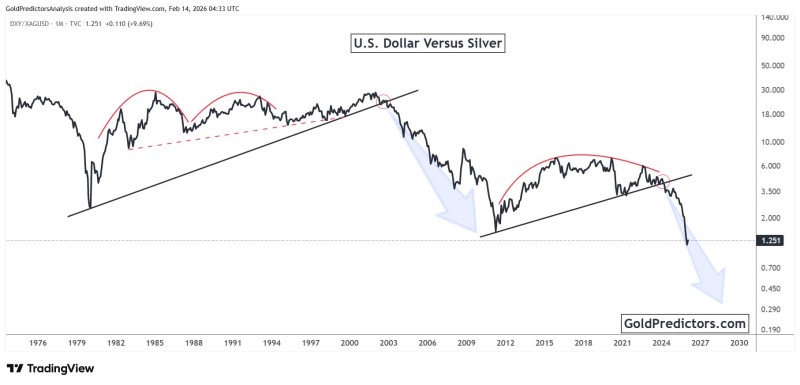
⬤ The long-term chart shows several historical phases where the ratio peaked near resistance before falling sharply once support broke. The current breakdown follows this same pattern, with the ratio now trading much lower compared to previous cycles. This loss of trend support lines up with past instances where silver gained strength as the dollar weakened.
⬤ A weakening ratio fits with broader setups favoring precious metals, as multiple technical analyses show silver holding firm at key price levels. The article Silver Price Prediction: Breakout Could Target $63 highlighted structural breakout levels in silver's longer-term trend that could push prices higher.
⬤ Another piece, Silver Price Approaches $50: Testing Critical Resistance Levels, outlined how decisive tests at major resistance zones could shape silver's direction as momentum builds in the metals market.
⬤ The break lower in the U.S. Dollar versus Silver ratio highlights broader market dynamics where periods of dollar weakness have historically aligned with stronger silver performance. Continued movement below structural support may signal shifting pressure in metals trading, potentially creating conditions that support higher silver prices going forward.
 Alex Dudov


