Usman Salis
After a choppy trading session, Silver (XAG) hit a crucial technical floor near $47.50, reigniting hope among traders watching for a turnaround. The bounce has caught the attention of chart watchers who think Silver might be carving out the left shoulder of an Inverse Head and Shoulders pattern—a classic bullish signal.
Technical Picture: Clean Bounce at Support
Silver's precise touch at the lower support zone lines up with what could be the structural completion of an IHS left shoulder, according to trader TBones. The hourly chart shows buyers stepping in around $47.45–$47.60, where horizontal support meets an upward trendline.
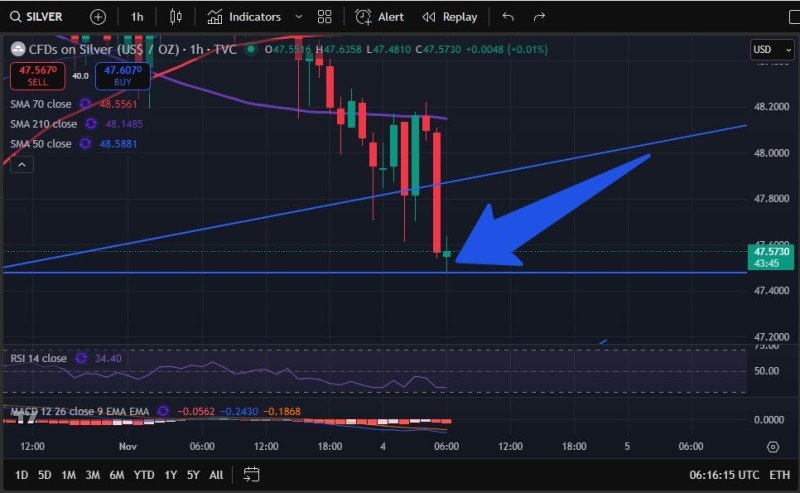
Overhead, the $48.00–$48.20 area remains key resistance, matching the neckline of the emerging pattern. The SMA50 at $48.59 and SMA210 at $48.15 create short-term hurdles but also potential breakout targets. Those long lower wicks on recent candles confirm buyers are defending the $47.5 level.
Momentum Indicators Signal Potential Shift
The RSI sits around 34.4, putting Silver in oversold territory where bounces often happen. The MACD histogram is flattening out, suggesting selling pressure is fading. Recent candles show lighter volume, hinting bears might be running out of steam. If prices push back above $47.80, these signals point to a near-term reversal.
Macro Backdrop Favors Precious Metals
Silver's rebound comes as the dollar weakens against major currencies and Treasury yields stabilize—conditions that typically help precious metals. Growing demand from renewable energy manufacturing provides solid underlying support.
 Usman Salis