 Usman Salis
⬤ Silver (XAG/USD) just got hammered before catching a breath on the hourly chart, trying to claw back from recent lows. The bounce has hit that classic Fibonacci 0.5–0.618 zone—the kind of spot where corrective rallies tend to fizzle out rather than flip the script. Price is chopping around in this band with tight-range candles, showing the market's just not sure where it wants to go next.
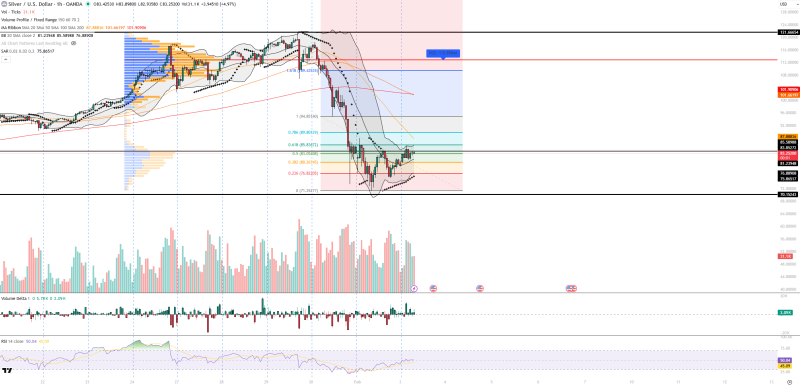
⬤ But here's the thing: the bigger picture is still bearish. That previous downtrend is still calling the shots, and moving averages overhead are acting like a ceiling. The RSI is hanging around 50—totally neutral territory with no real muscle behind the move. Plus, volume during this bounce? Pretty weak. That tells you buyers aren't exactly rushing in with conviction.
⬤ Other signals back up the idea that this is just a technical bounce. The Volume Profile shows the point of control sitting near 112.86—way above where we are now—meaning the real action and balance in this market is still overhead. Volume Delta shows a bit of buying, but nothing aggressive. Bollinger Bands have price drifting back toward the middle band, which fits a correction vibe, not a reversal. And the Parabolic SAR flipped below price, which supports a short-term bounce within a bigger downtrend.
⬤ This setup matters because silver moves fast when the dollar, rates, or risk sentiment shift. With volatility cranked up and this bounce looking shaky, how price reacts at these resistance and support zones will tell us where we're headed next. Until we get clearer confirmation, this looks like a fragile bounce inside a market that's still leaning down.
 Usman Salis


