Saad Ullah

Silver's been grabbing traders' attention this week as it builds what looks like a textbook bullish reversal pattern.
The Technical Setup
After a sharp pullback from late October highs near $57, the metal has settled into a consolidation phase—and now technical analyst UseliNk is spotting an inverse head and shoulders setup that could signal the end of the correction. If silver can break above $49.50, the target sits around $53.60. Here's what the chart is telling us.
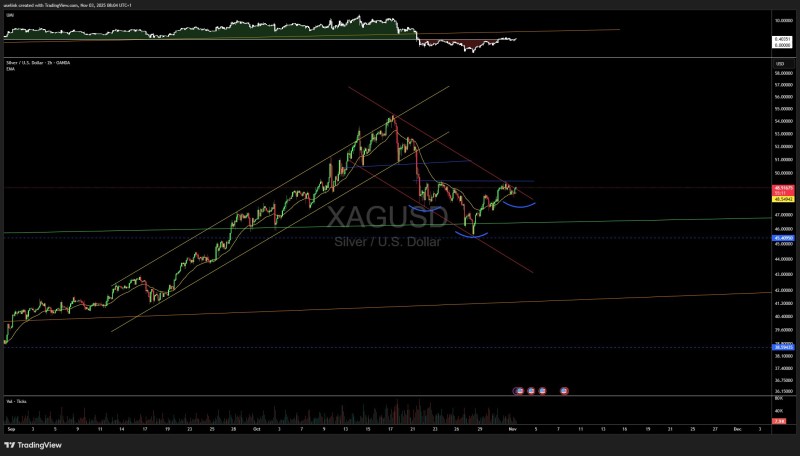
The inverse head and shoulders pattern is coming together nicely on the 2-hour timeframe:
- Left shoulder formed around $47.50
- Head hit a low near $46.40—marking the recent bottom
- Right shoulder is now shaping up just above $47.80–$48.00
The critical level to watch is the neckline at $49.50. A clean break above that would activate the pattern and point toward a measured move to $53.60. Meanwhile, the RSI is showing early signs of a bullish divergence—momentum is picking up even though price hasn't moved much yet. That's usually a good sign that a reversal might be brewing. Volume has been steady during this consolidation, and if we see a spike near the breakout level, that'll be the confirmation bulls are looking for.
What's Driving the Setup?
Silver's technical picture is getting a boost from a few macro tailwinds. The dollar's been softening lately, which typically helps commodities. There's also ongoing safe-haven demand tied to inflation worries and shaky global growth prospects. And let's not forget silver's industrial side—demand from electronics and green energy tech keeps the long-term story intact.
Silver's sitting at a turning point. If it breaks and holds above $49.50, we could see a quick move toward $53.60. But if support around $46.40 gives way, the pattern falls apart and we're probably looking at more sideways action. For now, $49.50 is the level that matters—that's where silver's next big move gets decided.
 Saad Ullah