 Marina Lyubimova

Silver is approaching a critical turning point. The chart structure suggests a prolonged corrective phase is nearing its end - but there may be one more move lower before any sustained rally begins. According to Economic Office, the current setup reflects a nearly completed Elliott Wave 4 correction, with Wave 5 potentially targeting $150 on the other side.
The Downtrend That Framed Wave 4
Silver entered a Wave 4 correction after completing a Wave 3 peak above $110. Since then, price has gradually declined toward the current zone near $68, forming a controlled pullback rather than a chaotic breakdown. A descending red trendline has capped every rebound attempt along the way, acting as dynamic resistance throughout the corrective phase.
As discussed in Silver Price Analysis: XAG/USD Drops 26% in Historic Daily Selloff, sharp declines in silver often reshape market structure in ways that set up the next major move. That context matters here.
W-X-Y Structure Near Its Final Leg
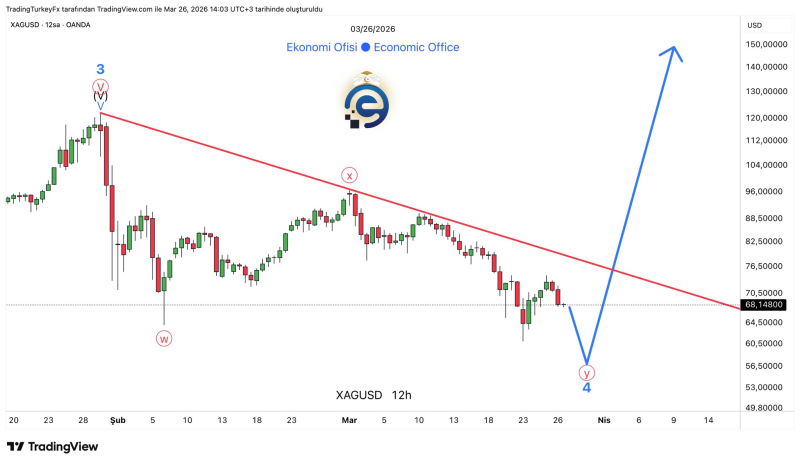
The chart explicitly maps out a W-X-Y corrective formation. The initial drop (W) and the recovery phase (X) are already complete. What's unfolding now is the final Y wave. Price action near the lower range has been compressing - smaller candles, reduced volatility - which are typical signals of a late-stage correction running out of steam.
The mid-$60s have held as a floor multiple times, which gives some credibility to the idea that sellers are losing momentum rather than accelerating lower. Silver (XAG/USD) Price Prediction: Wave 4 Pullback Could Trigger Rally explored exactly this dynamic - how corrective phases in silver tend to precede sharp impulsive moves once the structure completes.
Key signals to watch include:
- Price compression near the lower range (smaller candles, reduced volatility)
- The mid-$60s holding as a floor on multiple tests
- A descending red trendline acting as dynamic resistance near $68-$70
- A decisive break above that trendline as the primary confirmation signal
One More Dip Before the Turn
The projected path on the chart calls for one more move lower, potentially into the $55-$60 region, before Wave 4 officially wraps up. That would finalize the Y wave and clear the way for Wave 5 to begin. The descending trendline currently sits near $68-$70, and price is consolidating just below it - still in correction mode, but increasingly compressed.
The key structural signal to watch is a decisive break above that descending trendline, followed by a shift from lower highs to higher highs. Without that, the correction is technically still alive.
The Transition Toward Expansion
If Wave 4 completes as projected, Wave 5 would represent a significant expansion phase - with the chart targeting $150, well beyond previous highs. Silver (XAG) Price Analysis: Break Above $89 Could Target $120 to $150 laid out the mechanics of that kind of breakout scenario, showing how clearing major resistance zones has historically led to accelerated upside in silver.
For now, silver sits at a turning point. The downside looks limited to one final leg, but the larger move depends entirely on whether buyers can reclaim control and break the trend that has defined the past several weeks. The structure is in place - confirmation is what's still missing.
 Marina Lyubimova


