Usman Salis
⬤Silver has entered a sharp correction, sliding roughly 46% from its all-time high near $122 to the mid-$60 range. The move echoes past major drawdowns, including a 90% collapse in 1980 and a 70%-plus decline in 2011, both of which followed parabolic rallies. What is notable this time is the speed of the run-up: silver surged from around $30 to above $121 in less than a year before the current pullback began.
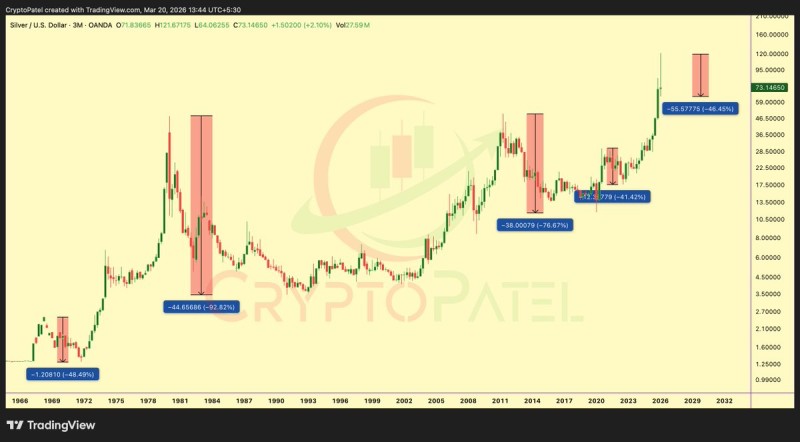
⬤Historically, recovery from these peaks has been slow. The 1980 crash led to a decades-long rebuild, while the 2011 cycle took over ten years to reclaim prior highs. But recent behavior hints at an accelerating rhythm. The 2020 cycle rebounded within months, pointing to faster capital rotation and a changing market structure. Analysts tracking Silver Price Analysis: $72 Support Faces 1.5% Breakdown Risk see the $50-$70 band as a historically strong accumulation zone where institutional buyers tend to re-enter.
⬤On the technical side, silver is consolidating near key support following the sell-off. Triangle formations and range compression are emerging as potential continuation signals. Recent analysis in Silver Holds Trendline Near $72 as $159 Year-End Target Remains Intact highlights trendline support as critical, while XAG Silver Price Prediction: Elliott Wave Pattern Targets $150 outlines a wave structure that points to a potential $150 target if support holds.
⬤The bigger picture may ultimately be shaped by fundamentals rather than chart patterns. Supply deficits, rising industrial demand tied to solar panel manufacturing and electric vehicles, and broader ETF accessibility are creating a market environment that did not exist in prior cycles. If these drivers hold, silver's next recovery could move faster and reach higher than historical averages suggest, making current support levels a closely watched setup for both technical traders and longer-term investors.
 Usman Salis