 Usman Salis
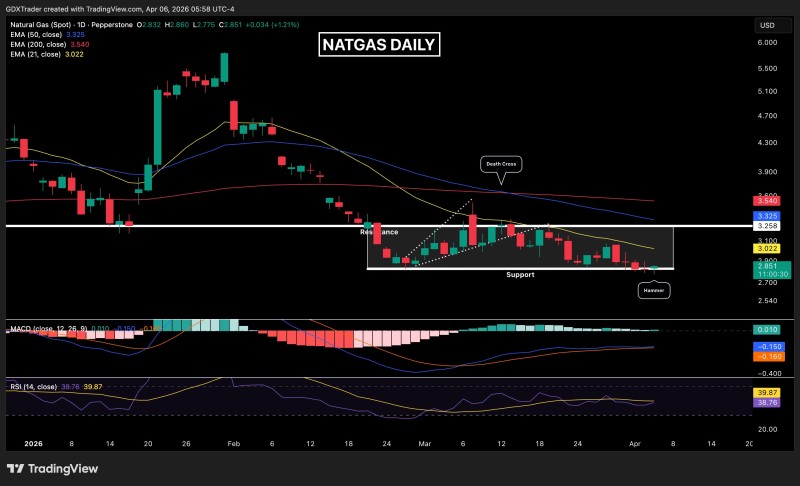
Market analyst GDXTrader flagged an important development in natural gas price action: a hammer candle has formed at a well-defined support zone, pointing to early buyer activity and a possible counter-trend bounce after weeks of sustained selling pressure.
NATGAS Hammer Pattern Appears at Key Support Base
The chart shows natural gas trading within a defined low base, where price has repeatedly tested support near the lower boundary. The latest daily candle prints a hammer - a formation typically associated with rejection of lower prices and an initial buyer response at a critical floor.
Buyers are defending this level at the support base, with the hammer candle confirming short-term rejection of lower prices.
This reaction follows a sustained decline in which natural gas has struggled to build any meaningful upward momentum. The pattern suggests that at least for now, sellers are losing their grip at this particular level. For broader context on how similar setups have played out, NATGAS Low Base Pattern Signals Persistent Weakness offers a useful reference point.
Broader NATGAS Structure Remains Clearly Bearish
Despite the bounce signal, the overall technical picture has not improved. Natural gas continues to trade below its major moving averages - the 21 EMA, 50 EMA, and 200 EMA - all of which are sloping downward, compounding the bearish case.
The death cross visible on the chart reinforces the downside bias - the prevailing trend has not yet shifted.
A death cross is clearly visible on the chart, confirming that the primary trend remains intact to the downside. Rallies have been limited in scope, with price staying confined beneath layers of moving average resistance and failing to establish any breakout structure above them.
As documented in Natural Gas Holds $2.86-$2.93 Micro Support Zone Amid Descending Trendline Pressure, this type of low-base consolidation frequently reflects persistent weakness when price cannot push through overhead resistance.
Lower Timeframe NATGAS Signals Offer Tactical Setup
While the daily trend stays bearish, the setup does open a door on shorter timeframes. A bullish falling wedge has formed on the hourly chart, accompanied by a morning star reversal pattern printed directly at support - two signals that, when combined, tend to carry more weight than either would alone.
The falling wedge on the hourly chart paired with the morning star at support creates a defined-risk opportunity for a tactical counter-trend position.
This combination points to a potential tactical long - not a trend reversal call, but a short-term counter-trend bounce within the larger downtrend. The structure offers several important characteristics:
- Buyers are reacting at a well-defined support zone
- Momentum on lower timeframes is beginning to shift
- The setup carries clear invalidation if support breaks
For historical perspective on how sharp recoveries can develop even inside bearish structures, Natural Gas Jumps 12% in Its Biggest Rally Since May shows just how quickly sentiment can shift when a support level holds firm.
Natural gas currently sits between short-term recovery signals and longer-term bearish pressure - a condition that favors tactical positioning over conviction-driven trend trades until the bigger picture resolves.
 Usman Salis


