 Saad Ullah
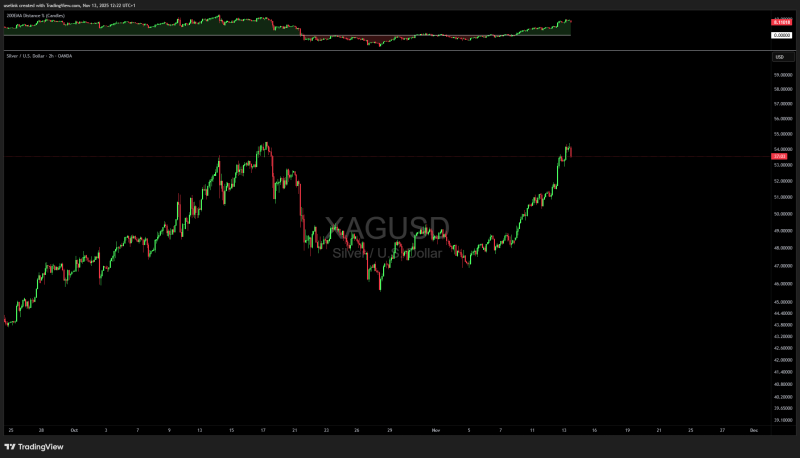
⬤ Silver's recent price action is looking eerily familiar to anyone who watched gold's earlier breakout. The XAGUSD 2-hour chart shows silver surging from the mid-$40s to around $54 before hitting some near-term resistance. The shape and momentum of this move mirror the structure gold carved out right before its big rally—a pattern that's got traders paying attention.
⬤ The appeal here is obvious: if silver follows gold's playbook, we could be looking at the start of a broader bullish run. But there's a flip side. Banking on silver behaving exactly like gold can be risky—commodities don't always stick to the script. If this pattern fails to hold, traders who positioned aggressively (especially with leverage) could face quick losses or get stopped out. Pattern recognition is useful, but it's not a guarantee.
⬤ The comparison focuses on the steep recovery followed by a rising structure—basically the same setup gold had before it took off. The chart confirms silver's strong upward momentum is building in a similar way. No specific price targets have been thrown around; this is more about recognizing the visual similarity and what it might mean if the pattern continues to develop.
⬤ For investors, this matters because silver typically trails gold during big commodity rallies—but when it catches up, it can move fast. If silver keeps following gold's template, expect increased volatility and potentially sharper price swings. That said, without clear technical confirmation yet, smart money will be watching closely and managing risk carefully. The next few sessions should tell us whether silver is really ready to mirror gold's breakout or if this comparison falls apart.
 Saad Ullah


