 Marina Lyubimova

⬤ The Bitcoin to gold ratio is attempting to find its footing after a brutal selloff, currently trading around 21.76 on the three-day chart. What's catching traders' attention is the potential double bottom pattern forming at this level—a classic signal that the downtrend might be running out of steam. After breaking down from the 28-30 range earlier this year, the ratio has been under serious pressure, but this recent price action suggests the bleeding might be slowing.
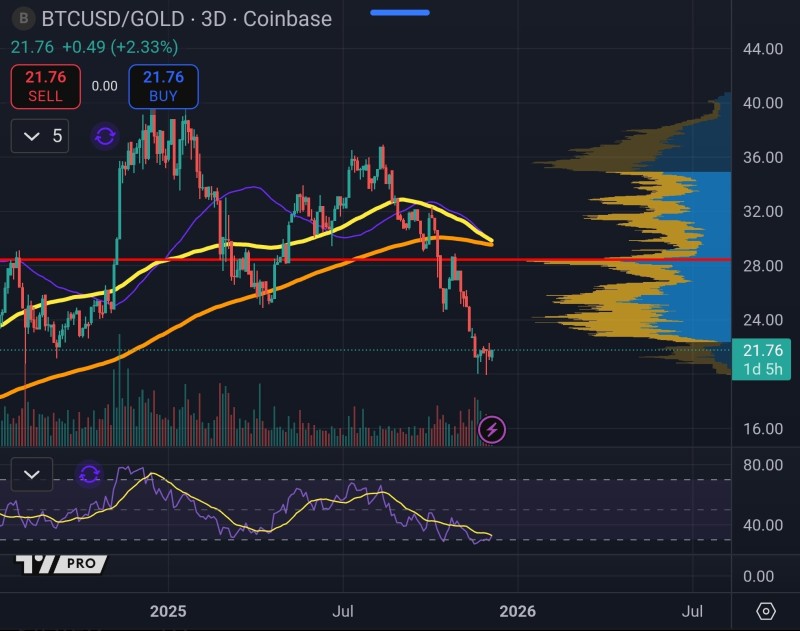
⬤ The technical picture tells a story of struggle. BTC relative to gold hasn't been able to climb back above its key moving averages—both the 50-day and 200-day lines are still pointing downward and acting as barriers overhead. Looking at the volume profile, there's a massive cluster of past trading activity sitting between 28 and 32, which used to be the battleground zone. The current price near 21.7 sits well below all that action, showing just how far this ratio has fallen before trying to catch its breath.
⬤ Right now, we're seeing candles bunch up near recent lows—that's the double bottom taking shape. But don't get too excited yet. For this to turn into something real, BTC priced in gold needs to push through those falling moving averages and break into the heavier resistance zone starting around 27.5. The RSI indicator is sitting pretty low, which matches the extended weakness we've seen, but it also means there's room for a bounce if buyers step in. This is the first serious attempt at stabilization since mid-summer.
⬤ Why does this matter? If Bitcoin can hold support here and start climbing, it could mark a turning point in how BTC performs versus gold. A confirmed double bottom usually means the dominant trend is exhausted and ready to flip. Traders will be watching whether BTC can defend this base and start pushing into those higher resistance areas—that would signal a real shift in the risk-on versus safe-haven dynamic between these two assets.
 Marina Lyubimova


