Peter Smith

⬤ Gold is sitting near all-time highs after a long rally, trading around $4,330 to $4,350 on the two-hour chart. Price is holding above previous support while forming a narrowing pattern just under resistance. The metal is now approaching a critical technical zone, and if the current structure breaks upward, higher levels could be in play.
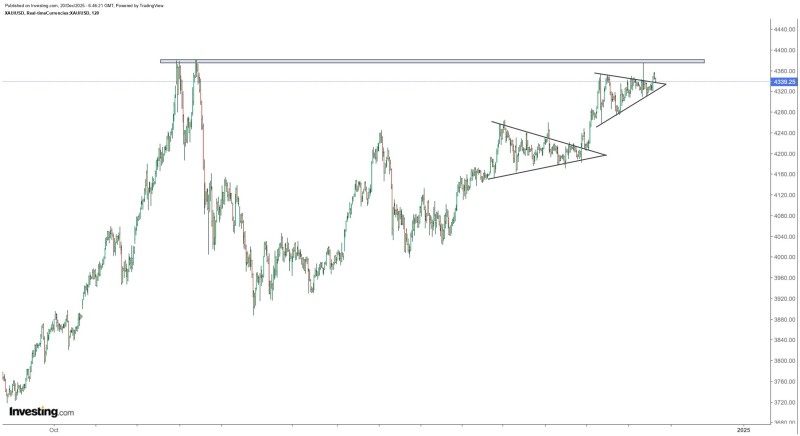
⬤ The chart shows a strong uptrend that started from the $3,700 area, with gold making steady higher highs and higher lows. After hitting $4,400, the price didn't reverse—it started consolidating instead. This pause has created a series of triangle-like patterns, showing that buyers and sellers are more evenly matched without breaking the bigger upward trend.
⬤ Pullbacks during this consolidation have been shallow, with price consistently finding support above $4,200 to $4,250. The repeated squeezing near resistance suggests volatility is building rather than fading. The $4,400 level continues to act as a ceiling for now, while trendlines below show steady buying interest whenever price dips.
⬤ This matters beyond just gold itself. The metal often reflects changes in economic outlook, currency moves, and overall market risk appetite. When gold consolidates near highs for this long, it can affect sentiment across commodities and related assets. How this tight range resolves will likely set the tone for momentum in the near term and show whether the trend continues or gold gets stuck in a range.
 Peter Smith