 Usman Salis

⬤ Gold tried to push higher on the 15-minute chart but couldn't escape the broader downward trend. After bouncing from recent lows, prices climbed toward the $4,770-$4,780 zone before hitting a wall of selling pressure. The rebound's happening against a backdrop of a stronger dollar and cooling geopolitical risks—both factors that typically don't favor gold.
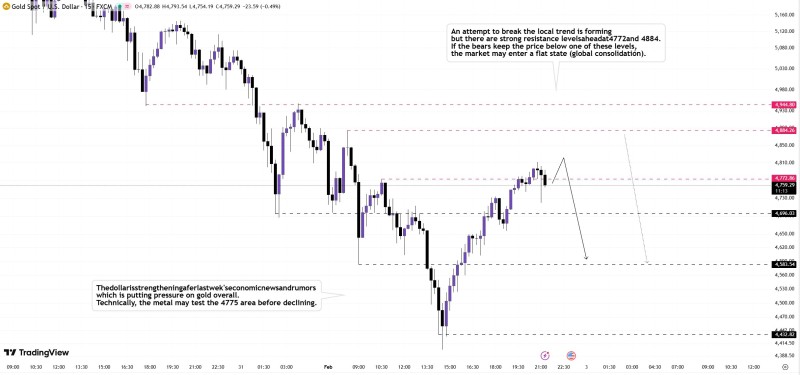
⬤ The chart shows several resistance zones that keep blocking upward moves. There's initial resistance around $4,470-$4,475, with a bigger barrier sitting near $4,885. Price action keeps hesitating below these levels, which tells us the bullish attempts are more about correcting recent losses than starting a new uptrend. If sellers manage to hold gold below these resistance areas, we're probably looking at extended sideways trading rather than any meaningful breakout.
⬤ Support levels are clearly marked at $4,696, with another zone around $4,583 below that. If selling picks up steam, prices could drop as far as $4,432. The chart suggests gold might retest resistance before sliding back down—pretty typical behavior during corrections. What happens next largely depends on incoming US economic data, since dollar strength has been directly moving gold prices lately.
⬤ This technical picture matters because gold often reflects broader economic expectations and currency shifts. With XAU/USD trapped between well-defined resistance and support levels, upcoming data releases will likely decide whether prices stay range-bound or extend the pullback. As long as gold can't break above key resistance, expect choppy trading that moves in sync with the dollar and economic outlook.
 Usman Salis


