Saad Ullah
Gold just won't quit. Currently hovering around $3,985, gold remains locked inside a steady upward channel that's been intact for nearly two years. The forecast? A push toward $5,000 by 2026, with the potential to go even higher beyond that.
The Technical Setup
After a relentless climb through 2023 and 2024, the yellow metal is still trading near all-time highs—and according to trader mühendisborsa, it's just taking a breather. Gold's chart tells a clear story. It's been making higher highs and higher lows since early 2023, staying well within a rising parallel channel. Right now, the upper resistance sits around $4,200–$4,250, while the lower trendline near $3,800 acts as strong support.
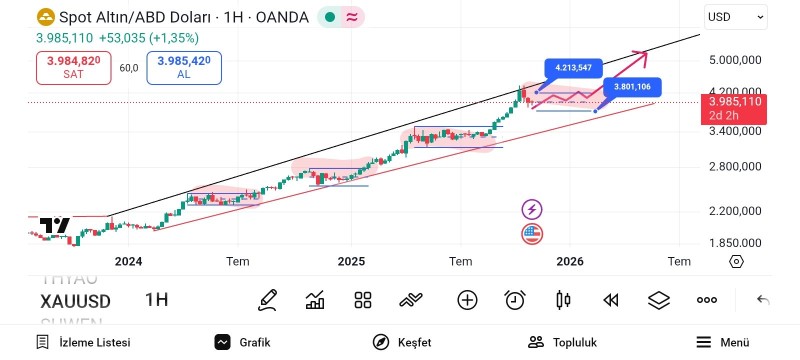
The red-shaded zones on the chart mark past consolidation periods—short pauses where gold caught its breath before resuming the climb. We're likely in another one of those phases now. If history repeats, gold could trade sideways for a few more weeks before breaking out toward $4,500, then eventually crossing $5,000 as we head into 2026. Every pullback so far has been met with buying interest, showing that demand—especially from institutions—remains solid.
What's Fueling the Rally?
A few big-picture forces are keeping gold's momentum alive:
- Central banks are stacking physical gold amid rising geopolitical tensions
- Sticky inflation keeps real yields low, making gold attractive as a store of value
- Dollar weakness could accelerate if the Fed moves toward rate cuts
- Recession fears are pushing investors into safe-haven assets like gold
These macro tailwinds align perfectly with what the chart is showing—a bull market that's far from over.
 Saad Ullah