 Eseandre Mordi

Gold (XAU) impressive multi-month rally may be entering a cooling phase, as the weekly chart reveals one of the most stretched price structures in recent years. Technical analysis shows that gold's weekly, monthly, and quarterly timeframes are now overextended to the upside, suggesting the metal could be due for a healthy pullback before its next major move.
Weekly Chart Shows Exhaustion Signs
The chart confirms this assessment pretty clearly. Gold climbed almost vertically throughout 2024 and 2025, with buyers stepping in at every pullback as price stayed tight above a rising moving average.
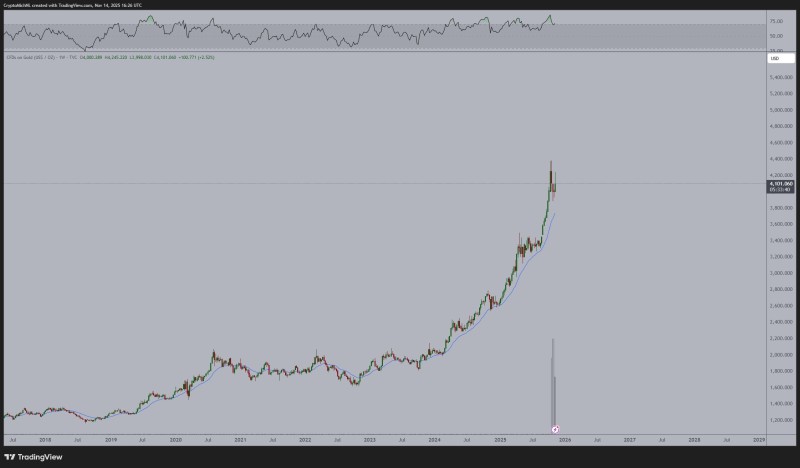
However, recent weekly candles show rejection from the highs near $4,250, with momentum indicators like the RSI pushing into overbought territory. This lines up with warnings that upside momentum is becoming too skewed.
Why This Correction Makes Sense
A retracement toward $3,600–$3,700 would actually be structurally healthy. From a technical standpoint, this level lines up with a retest of mid-trend support, allows momentum to cool after a parabolic move, and matches an earlier consolidation zone visible on the chart. This kind of correction wouldn't signal weakness in gold's broader uptrend—it would just represent normal stabilization after a historic rally.
What This Could Mean for Crypto
Here's something interesting: gold consolidation often coincides with renewed strength in risk-on assets, especially crypto. As gold stabilizes, liquidity and speculative appetite may rotate back toward crypto markets, potentially supporting strong upside moves there.
The Takeaway
Gold remains fundamentally strong, but the chart clearly signals that momentum needs to cool before any renewed climb. A pullback to $3,600–$3,700 fits well within normal technical expectations and could set up the next leg higher. Meanwhile, crypto traders might find opportunity if capital temporarily shifts away from precious metals and into risk-driven assets.
 Eseandre Mordi


