 Peter Smith

Gold (XAU) is gaining fresh momentum as XAU presses against a major resistance shelf following several days of consolidation. The metal is now attempting to shift out of a narrow trading range—a pattern that often precedes stronger volatility and hints at a potential new directional phase.
Gold Strengthens as Market Structure Tightens
After stabilizing near a critical demand zone, gold is showing signs of renewed strength. The latest technical analysis shared by trader Korayy outlines a clean roadmap based on order flow dynamics, a 4-hour Fair Value Gap, and overhead liquidity targets.
The setup suggests buyers are positioning for what could be the next leg higher, with price action now testing key resistance levels that have kept the market contained for nearly a week.
Order Flow Support Holds Firm at Demand Zone
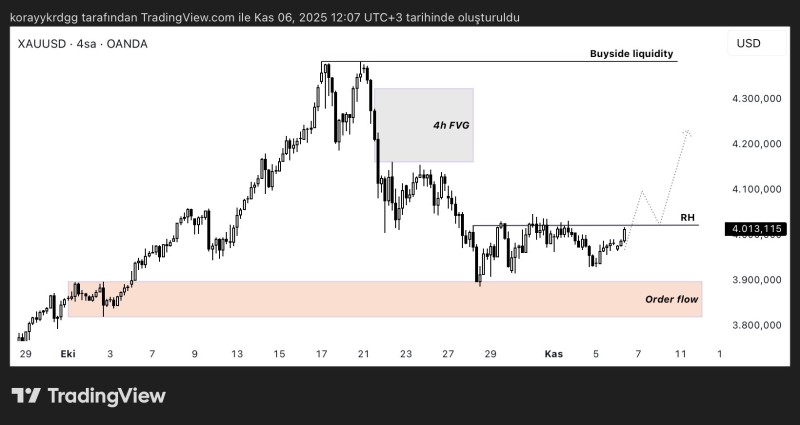
The chart reveals a large order flow zone beneath recent price action, marked in light red, which provided strong support throughout the final days of October. Each time price revisited this area, buyers stepped in aggressively, generating sharp upward reactions that prevented any deeper selloff. The consistent defense of this zone indicates active accumulation on dips and maintains a bullish bias in the short term, giving traders confidence that downside risk remains limited as long as this support holds.
Unfilled 4h FVG Signals an Upside Target
A prominent 4-hour Fair Value Gap created during a rapid decline remains unfilled above current price levels. These inefficiencies typically function as magnets during trend reversals since markets naturally tend to revisit gaps to rebalance price delivery. The presence of this FVG directly above the mid-range structure aligns perfectly with the current upward drift in XAU, suggesting the market may continue climbing toward this imbalance before forming its next decisive move.
RH Level: A Critical Threshold Before Liquidity Above
Recent candles show gold approaching the RH level after consolidating sideways for nearly a week. A sustained move above this threshold would shift the short-term structure and clear the path toward a large buyside liquidity pool positioned near previous swing highs. The dotted path on the chart reflects this scenario, showing a potential reclaim of the RH level, a small retest to confirm support, and an extension toward the upper liquidity area around the 4.20M mark. This layout is consistent with an emerging bullish sequence that technical traders are watching closely.
 Peter Smith


