 Saad Ullah

⬤ Gold's weekly chart on XAU/USD is showing a familiar pattern—one that's appeared before at local tops and typically resolved with sideways consolidation rather than a sharp reversal. The latest candle shows price stalling near recent highs with a modest pullback, not the kind of aggressive selling that would signal a trend change. This mirrors earlier phases where gold paused briefly before pushing higher again.
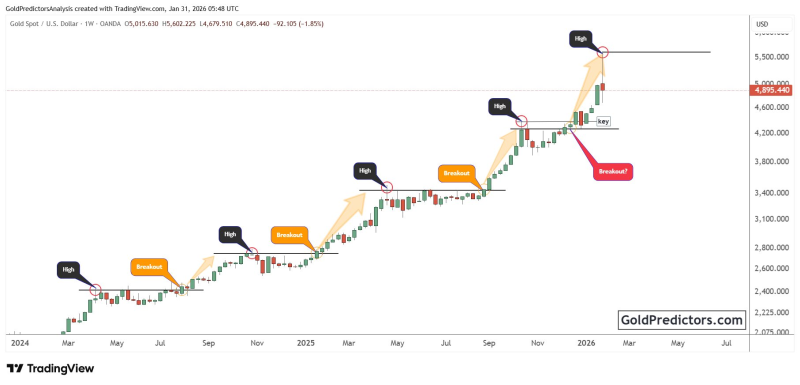
⬤ Looking at previous cycles on the chart, similar weekly candles marked temporary exhaustion points that led to consolidation above breakout levels instead of deeper corrections. The pattern keeps repeating: gold forms a local high, trades sideways while holding support, then eventually continues climbing. The current setup fits right into that same sequence.
⬤ The key technical area right now is the $3,500–$4,000 price zone. In past consolidation phases, gold stayed above similar support levels after breakouts, giving the market time to stabilize before the next leg up. Despite the recent pullback, price is still trading above this range, which keeps the broader bullish structure intact.
⬤ The chart raises an obvious question: is this another breakout attempt or just a consolidation pause? So far, there's no confirmed reversal—price hasn't broken below the highlighted support. Instead, it's following the familiar cycle of advance, brief topping action, and consolidation within an ongoing uptrend. For traders, the setup matters because these recurring weekly patterns often shape expectations around trend continuation and volatility heading into the next move.
 Saad Ullah


