 Marina Lyubimova

⬤ Gold is holding near elevated levels following a strong rally, with the daily chart showing prices consolidating above the $4,300 zone. The chart reveals a four-month ascending triangle that formed earlier this year, with resistance around $3,450 and a pattern of rising lows building underneath. Horizontal support and resistance levels continue to shape how gold moves right now.
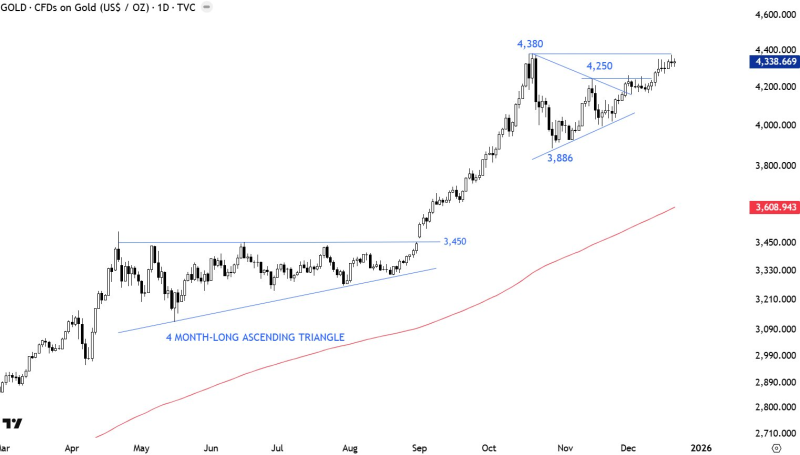
⬤ After breaking decisively above $3,450, gold surged toward $4,380 before running into major resistance and pulling back. That pullback found support near $3,886, which acted as a clear reaction point. What stands out here is how gold keeps respecting these previously established levels rather than moving erratically.
Horizontal support and resistance levels are a powerful concept in charting and are clearly shaping gold's recent price behavior.
⬤ Since holding above support, gold has pushed back above $4,250 and is now trading in a higher range. Price action shows consolidation near the upper boundary with higher lows forming inside the structure. The long-term moving average sits well below current prices, confirming the strength of the trend while these horizontal levels continue defining where gold reacts in the short term.
⬤ This matters because gold's behavior around these levels suggests the market is still finding price in an orderly way during a strong uptrend. When horizontal zones get tested, they often become focal points that influence volatility and direction. How gold interacts with these areas going forward will likely shape the next phase of this move.
 Marina Lyubimova


