 Saad Ullah

⬤ Gold just entered completely new territory, hitting a fresh all-time high as February 2026 futures climbed past $4,400 per ounce. Looking at the daily chart from Barchart, you can see a clean upward path that's been building for months, finally breaking out to these record levels. The precious metal hit this milestone after a steady climb that really picked up steam through December.
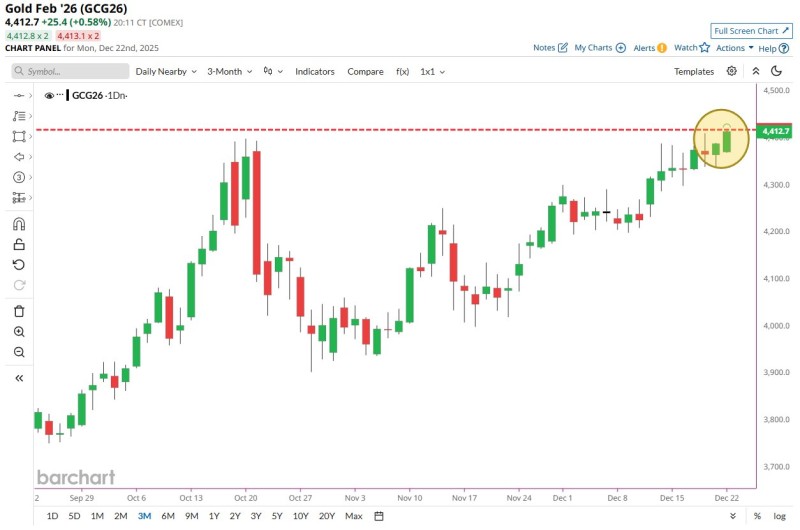
⬤ The chart shows a textbook bullish pattern that started taking shape back in late September, with gold consistently making higher highs and higher lows. After rallying in October, prices took a breather and dipped back toward the $4,000–$4,100 zone before charging higher again. Starting in mid-November, buyers stepped up their game, pushing gold steadily upward to the current $4,412 level shown on the chart. The latest candles are bunched up near the top, showing buyers are still active even at these elevated prices.
⬤ What makes this move interesting is how it played out—not as one explosive spike, but through a series of measured advances. The chart marks the old resistance zone with a red dashed line, which gold has now blown past convincingly. Once prices cleared that barrier, the upward momentum kept rolling, proving the trend has real staying power. The fact that we haven't seen any serious pullbacks during this latest leg tells you sellers haven't been able to get much traction.
⬤ This new peak matters beyond just gold itself. The metal often serves as a barometer for bigger picture stuff—how markets view risk, where capital is flowing, and what's happening across the macro landscape. When gold stays strong at record highs, it ripples through commodities, currencies, and related markets, while also shifting expectations around volatility. Now that gold's holding above its previous peaks, traders everywhere will be watching to see if these levels stick or if the longer-term uptrend on the chart keeps pushing even higher.
 Saad Ullah


