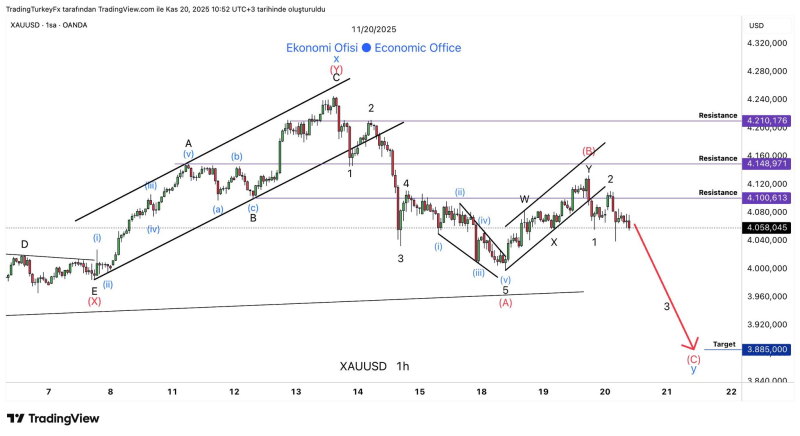
⬤ XAU/USD kept sliding after dropping below the $4,100 resistance zone. Gold's moving inside a tightening pattern on the H1 timeframe, and that recent breakdown under the key resistance area keeps the bearish vibe going strong. The breakdown shows that as long as prices stay pinned under $4,100, traders are expecting more downside ahead.

⬤ The charts show gold breaking through multiple resistance layers, including that critical $4,100–$4,108 zone, which basically confirms the bearish move is still in play. The earlier setup pointed to support around $4,020 as the line in the sand—break that and we're looking at a deeper drop. Right now, XAU is hanging below $4,100, which means more pressure is building toward that $3,885 target. The wave patterns on the chart also suggest previous upward moves are done, and now we're seeing a corrective pattern developing that's pointing lower.
As long as the price stays under 4,100, expectations favor continued downward movement.
⬤ There are already short positions opened at $4,226 and $4,115 that are still active and sitting in profit territory. The bearish scenario stays front and center while the market is trading underneath these resistance levels. The Elliott Wave patterns shown across the charts keep pointing in the same direction—if gold stays below resistance, this downward move could keep rolling toward the projected support zone.
⬤ Why do the $4,100 resistance and $3,885 target matter so much? These levels basically define where gold's heading in the short term. When prices stay below resistance like this, it signals sellers are in control, and that shapes how traders are feeling about momentum right now. If the drop actually reaches that $3,885 area, it'll be a major structural moment where the market figures out whether gold finds its footing or keeps sliding in this correction.
 Eseandre Mordi

 Eseandre Mordi


