 Victoria Bazir

Tesla shares are entering a decisive phase as recent selling pressure pushes the stock out of its tight consolidation range. While the broader trend remains intact, the current pullback highlights increasing caution among traders watching for a potential retest of key support levels.
Technical Overview: Structure, Trend, and Support Levels
The chart shows a three-month symmetrical triangle that Tesla broke to the upside in late September. The stock accelerated sharply from the breakout level near $356–$368, eventually hitting the marked price target around $435. After reaching this target, TSLA entered a horizontal consolidation zone between $445 and $485, forming a rectangle near recent highs.
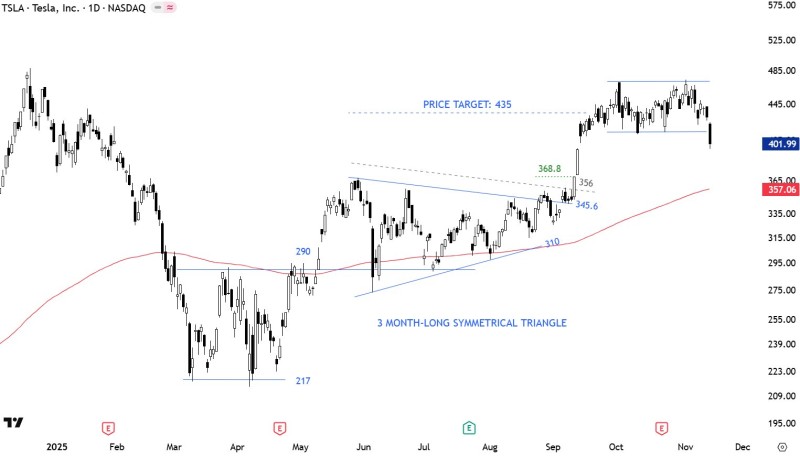
The latest move demonstrates a strong push below the lower boundary of that consolidation range, confirming weakness in near-term momentum. Despite this drop, the chart shows no breakdown of the major trend—price continues trading above the upward-sloping 200-day moving average.
Key Support Zones
- $368.8 — Prior breakout zone and initial reaction level
- $356 — Former triangle resistance now acting as support
- 200-Day Moving Average (~$357) — Major long-term trend floor
The current decline from around $401 places TSLA on track to approach this high-confluence demand zone. The chart also shows additional reference points at $345.6 and $310, which only become relevant if the 200-day average fails.
Why TSLA Is Pulling Back Now
The pullback appears primarily technical, triggered after completion of the symmetrical triangle target and rejection from the multi-week rectangle resistance. Market-wide softness in growth and tech names has added short-term pressure. Broader uncertainty in yields, macro data, and investor rotation has contributed to the decline. However, the larger uptrend remains intact above the 200-day line.
Correction Within Trend or Start of a Larger Move?
If TSLA stabilizes at the $357–$368 support cluster, the stock may resume its broader bullish path and reattempt a climb toward the $435 region before retesting the $445–$485 range. A decisive drop below the 200-day average, however, would mark a deeper structural shift and introduce a more bearish scenario.
 Victoria Bazir


