 Marina Lyubimova

⬤ Tesla shares are pushing toward an important technical area on the weekly timeframe, caught in a prolonged consolidation that's forming a tightening pattern. The stock is trading between a rising support trendline and a gently descending resistance line, creating a narrowing structure that shows volatility has dropped off after months of sideways movement.
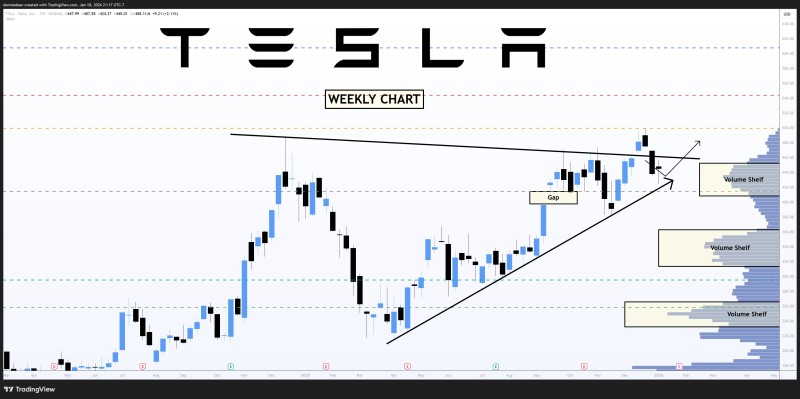
⬤ Since mid-2024, weekly candles have been printing higher lows consistently, showing that demand is holding up even though upward momentum has slowed. Every time price tests the upper resistance zone, sellers step in and keep it contained within the pattern instead of letting it break higher. This back-and-forth action shows the battle between buyers defending the trend and sellers capping the upside.
⬤ The chart reveals multiple volume shelves on the right side, marking areas where heavy trading happened in the past. These zones tend to act as support or resistance when price comes back to test them. TSLA is currently sitting above several key volume clusters, which suggests there's still solid demand underneath. There's also a price gap from late 2025 still visible on the chart, and gaps like this often play a role in how price moves going forward.
⬤ This setup matters for the broader market because Tesla often acts as a sentiment gauge for growth and tech stocks. If it stays above the rising trend support, that would reinforce confidence in the longer-term structure. But if it can't hold these levels, attention will likely shift to those lower volume zones. With TSLA squeezed between clearly defined boundaries, traders are watching the weekly action closely for signs of which direction it breaks next.
 Marina Lyubimova


