 Eseandre Mordi

⬤ Tesla Inc. shares (TSLA) are being watched closely as the stock trades near the upper boundary of a multi-year pattern. Tesla's price movements have often seemed disconnected from broader market trends—instead, they appear driven by the company's innovation cycles and product launches. The monthly chart reveals a historical pattern that stretches back over a decade.
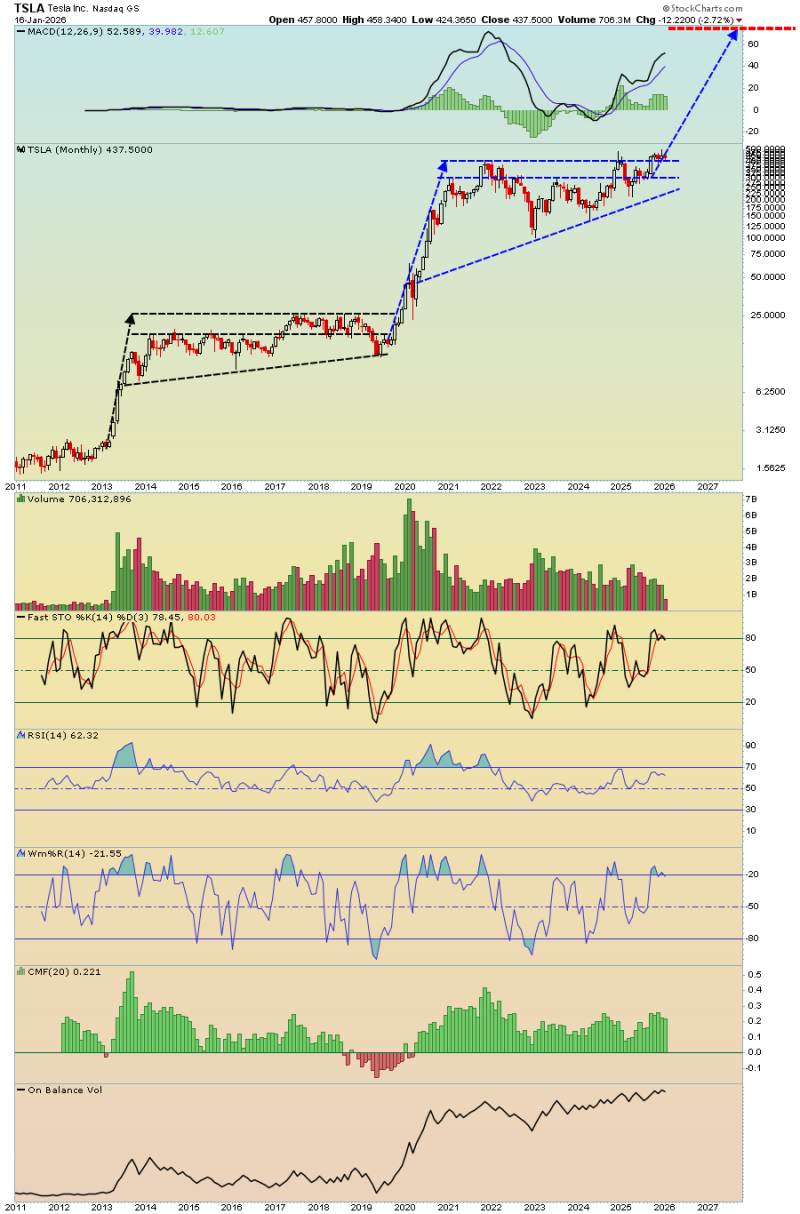
⬤ Looking at the structure, TSLA has gone through extended consolidation periods lasting roughly 5-6 years. During these phases, the stock showed high volatility, overlapping price ranges, and minimal net gains. But each consolidation was followed by a sharp burst of upward momentum. Right now, Tesla is holding above long-term rising support after breaking out of another multi-year consolidation zone, with price pushing higher inside an ascending channel.
⬤ Monthly momentum indicators look solid. The MACD is positive and climbing, while the RSI sits above the midline without hitting extreme territory. Stochastic readings are elevated but match what we've seen during previous expansion phases rather than signaling a top. Volume and on-balance volume are both trending upward, showing continued buying interest since the 2020 lows. If this technical framework holds, the chart projects potential price targets near $789-792 by late 2026, $1,078-1,186 by mid-2027, and $2,160-2,420 by 2030.
⬤ This setup matters for the broader market because Tesla has historically led during major growth cycles. Its long consolidation periods followed by explosive moves have often aligned with shifts in market sentiment and risk appetite. If TSLA continues following this multi-year technical pattern, it could remain a focal point among growth stocks while demonstrating how extended structural bases can shape price action over several years.
 Eseandre Mordi


