Saad Ullah

⬤ A recent Elliott Wave analysis highlighted Tesla's path through a double correction pattern that could shape its next move. The November 13 chart points to a technical zone between $395.50 and $346.80 where the current correction may wrap up before momentum shifts. This range is flagged as an area where traders might want to avoid selling.
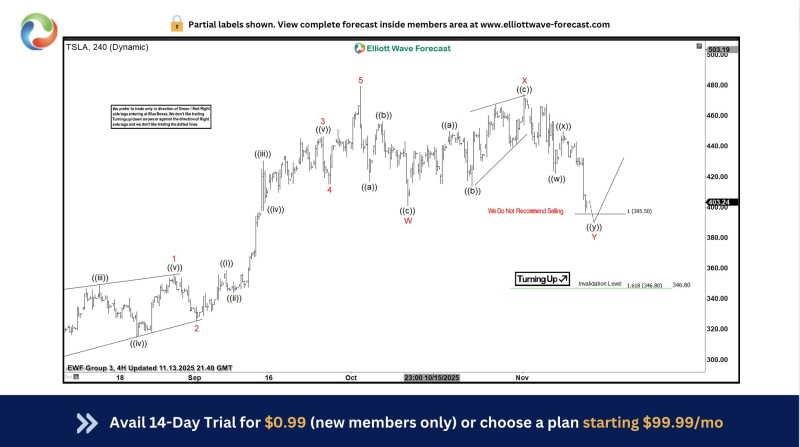
⬤ The forecast shows TSLA working through a WXY corrective structure after its earlier rally. The pattern includes nested waves that trace the pullback from recent highs. Key support sits at $346.80, marked by a 1.618 Fibonacci projection. Once the Y wave finishes in this zone, the stock may start building upward momentum again.
⬤ Tesla's earlier five-wave climb has given way to choppy sideways action with overlapping swings. A "Turning Up" signal near the lower boundary suggests a potential reversal if TSLA holds above $346.80. The correction stays valid as long as price moves within the outlined structure, making this zone critical for what comes next.
⬤ Large corrective areas like this often become turning points for market sentiment. The $395.50 to $346.80 range could shape expectations as Tesla moves through the final stage of its correction and sets up for the next trading phase.
 Saad Ullah