 Alex Dudov
⬤ Tesla Inc. shares are catching traders' attention again as the monthly chart structure looks eerily similar to the multi-year base that came before the company's explosive 2020 breakout. TSLA might be replaying the 2017-2020 pattern, just taking a bit longer this time around. The latest monthly candle closed near $408.54, down roughly 5.08% for the month, with price stuck right against a resistance band hovering around the $400 mark.
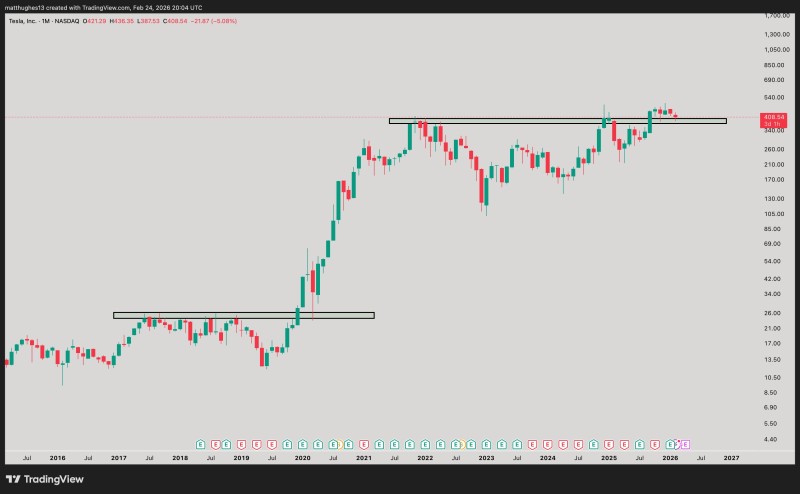
⬤ The chart highlights two critical horizontal zones. The first one covers 2017-2020, when TSLA spent years grinding sideways before finally breaking higher in 2020 and absolutely taking off afterward. The second zone captures what's happening now, where Tesla has been holding ground near $400 resistance for much of the post-2021 period, repeatedly bumping into that upper ceiling. Recent candles show TSLA back at this level again, cementing it as a major battleground where buyers and sellers keep clashing on the monthly timeframe.
⬤ The price action also tells an interesting story. After surging into the 2021-2022 peak above $400, Tesla took a nasty tumble, then slowly rebuilt momentum heading into 2025-2026, landing right back at the same resistance band. This echoes the "base then expansion" rhythm mentioned in the tweet's comparison, though the chart shows wider swings and deeper pullbacks than the earlier consolidation period. "The pattern is stretching longer, but the setup remains intact," one analyst noted when reviewing the monthly structure. Similar technical coverage has kept tabs on this same $400 zone as a make-or-break level, including analysis showing Tesla holding $404-$409 support while eyeing a $421 break.
⬤ This TSLA stock analysis matters because multi-year ranges on the monthly chart usually shape how the market thinks about what comes next, whether that's a big trend continuation or just more sideways chop. A clean break above the highlighted resistance zone would completely flip the chart's character, while another rejection at the same ceiling could lock TSLA into a broad sideways grind for longer. The current setup, as framed by the chart comparison, keeps everyone watching to see if Tesla's multi-year dance is building toward a decisive move or just stretching out the range even further.
 Alex Dudov


