 Marina Lyubimova

⬤ Tesla (TSLA) is hanging out near a significant long-term resistance level after a strong rally that kicked off with the 2020 breakout. Right now, the stock looks like it's gearing up for its next move—price is consolidating instead of pulling back hard from these elevated levels. The monthly chart shows TSLA stabilizing just under a horizontal zone that's been keeping a lid on upside momentum lately.
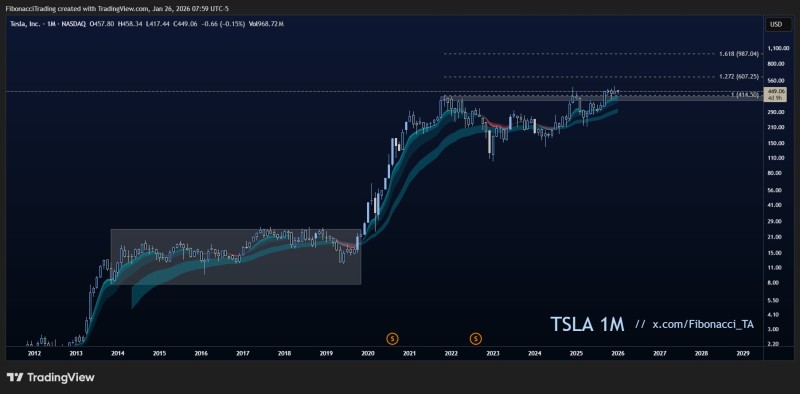
⬤ The chart shows Tesla's powerful structural transformation over recent years, breaking out from a multi-year base and locking into a sustained uptrend. Since that breakout, TSLA has consistently bounced off the rising EMA cloud, which has provided reliable support during pullbacks. Recent candles are tightening near resistance—a pattern that often signals trend continuation when there's no heavy selling pressure underneath.
⬤ After reclaiming the mid-$400 range, TSLA moved into consolidation mode beneath overhead resistance instead of reversing lower. Pullbacks have stayed shallow and held above trend support, suggesting buyers are still stepping in at higher prices. There's no visible surge in selling on the higher timeframe that would confirm a trend reversal is underway.
⬤ This setup matters because Tesla often sets the tone for high-beta growth stocks. A sustained hold above current support would validate the existing trend structure, while continued sideways action would simply mean the market is digesting prior gains. For now, the chart suggests patience—the market appears to be waiting for confirmation before making its next directional move.
 Marina Lyubimova


