Important Price Levels
The S&P 500 index fell 36% in just four weeks, marking the fastest market drop in history back in March. On average, since 1945, the average bear market has fallen by 33%. It usually takes 13 months for the market to reach its lows.
As a result of the major pandemic names like Boeing, the Dow Jones Industrial Average have fallen nearly 40%, which is usually a less volatile overall measure. The latest draw, which resulted in the Nasdaq setting its previous record for the shortest correction in history (just three days), seems to have stopped.
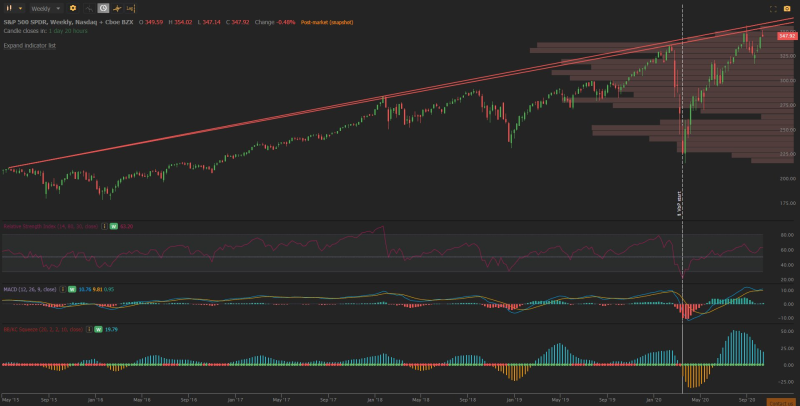
Nevertheless, the recent drop from the 350 level was natural. BlueMoonTrades analyst made a chart, which shows the resistance channel at the level of 350.
$SPY Weekly chart updatePull back was quite close to obvious as it approaches resistance again.But today's drop doesn't scare me much. It will have a hard time to break that resistance but we are not in a correction / bearish territoryConsider these as buying opportunities BlueMoonTrades @BlueMoonTrades via Twitter

The Index Is Growing on 'Dumb Money'
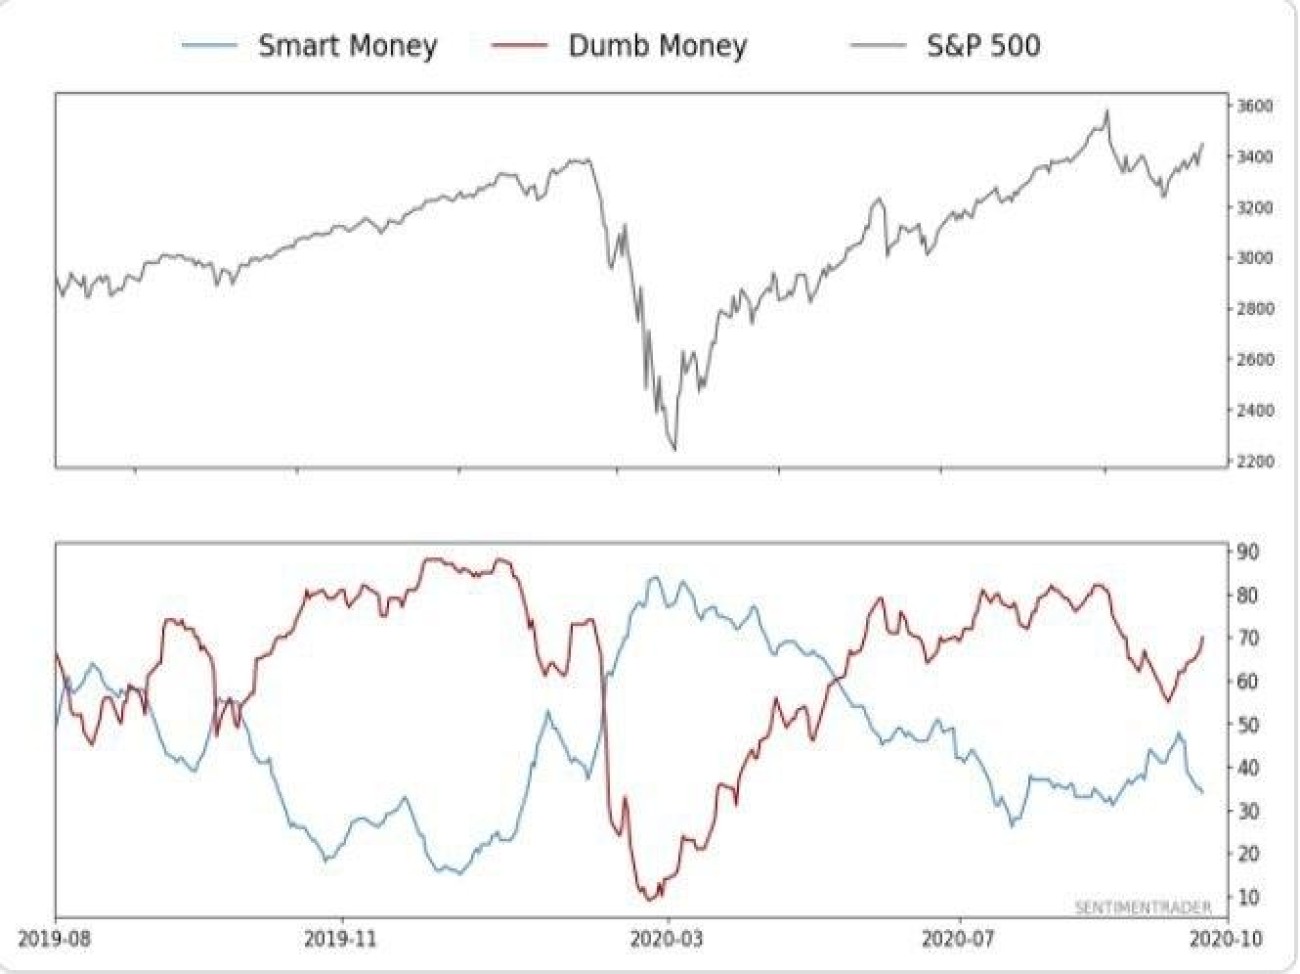
According to sentimentrader.com, smart money does not help the new S&P 500 to grow. Throughout the year, smart capital is a reasonably powerful proxy for potential market trend's forecasting. It cannot, however, be totally reliable. The growth of the index after the September's correction is now only driven by stupid capital.
Investment funds and large corporate investors include smart money. Their decisions are thought to be more balanced since they have connections, resources and time to analyze the financial markets much more thoroughly.

 Alex Dudov

 Alex Dudov


