 Saad Ullah

⬤ AST SpaceMobile has caught traders' attention after a strong multi-week climb, with weekly technical indicators lining up in a pattern that looks familiar. The last time both weekly Stochastic indicators crossed upward alongside the green whale signal, ASTS shot up from around $23 to roughly $61. That historical setup has people asking whether the same technical structure is forming again.
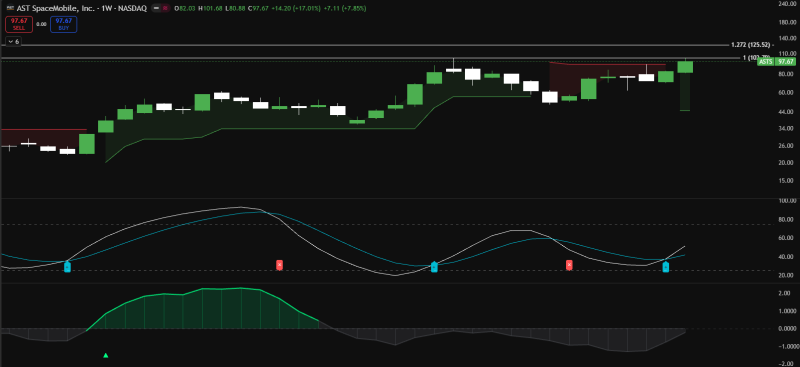
⬤ The weekly chart shows ASTS trading near recent highs, with the latest close just under $100 following a strong bullish candle. The weekly Stochastic indicators below the price chart are turning higher from lower ranges, signaling building momentum. What made the previous example noteworthy wasn't just a quick spike—it was a sustained upward trend. That's why traders are watching this setup so closely.
⬤ Recent price action shows AST SpaceMobile has been climbing steadily, putting in higher highs and higher lows on the weekly timeframe. Full confirmation would come with the appearance of the green whale signal, which historically has aligned with more durable rallies rather than short-lived pops. The stock is advancing quickly, but confirmation remains the critical factor for validating whether this trend has staying power or is just short-term volatility.
⬤ This technical setup matters because it demonstrates how repeatable indicator patterns can shape expectations around momentum stocks. A confirmed signal could strengthen confidence in continued upside, while missing that confirmation might shift focus toward consolidation risks after an extended move. With ASTS trading near elevated levels, the next weekly signals will likely shape near-term sentiment around price direction.
 Saad Ullah


