 Eseandre Mordi

⬤ Gold's holding strong in bullish territory on the four-hour XAU/USD chart. Here's the thing—after that recent push higher, prices are consolidating right above a critical support zone. The $4,550 area has become the line in the sand, giving the broader uptrend a solid technical foundation instead of showing any signs of running out of steam.
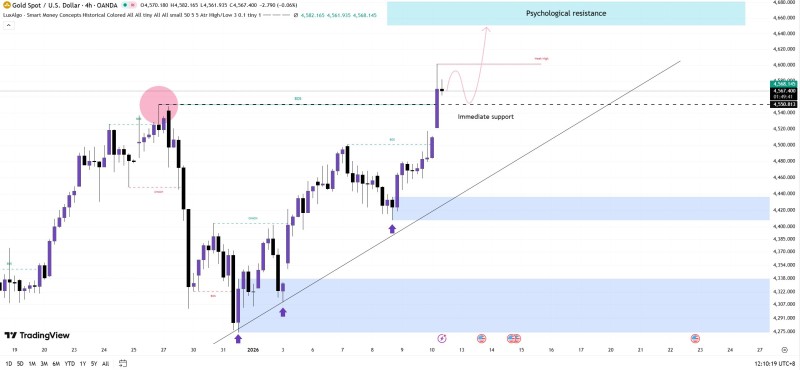
⬤ The chart shows a clean pattern of higher lows backed by an ascending trendline—exactly what you want to see when momentum's on your side. After reclaiming structure, gold marched toward the upper range where psychological resistance sits around the mid-$4,600s. Sure, there was a brief pause up there, but price hasn't given back the gains. Former resistance is now acting as support, which tells you buyers are still showing up on dips rather than letting deeper pullbacks develop.
⬤ Below current levels, you've got additional demand zones marked on the chart—those blue support areas where buying pressure kicked in hard before. They add extra weight to the technical picture. As long as gold stays above $4,550, these pullbacks look like standard corrections within the trend, not warning signs of weakness. The fact that we're not seeing aggressive selling pressure reinforces the idea that momentum's still working in favor of the bulls.
⬤ This setup matters for the bigger picture because gold often reflects what's happening with macro positioning and risk sentiment across markets. When you see sustained bullish structure with higher lows and defended support zones, that points to real demand rather than distribution. With price camping above immediate support and digesting gains below psychological resistance, traders are watching for continuation rather than worrying about downside risk right now.
 Eseandre Mordi


