 Peter Smith
⬤ SLB shares delivered another solid weekly performance, signaling what looks like a genuine bullish trend shift after months of sideways movement. The stock printed a bullish continuation candle on the weekly chart—not just a quick pop, but sustained buying pressure. Price has broken free from a descending channel and is now sitting comfortably above key technical markers as we move deeper into early 2025.
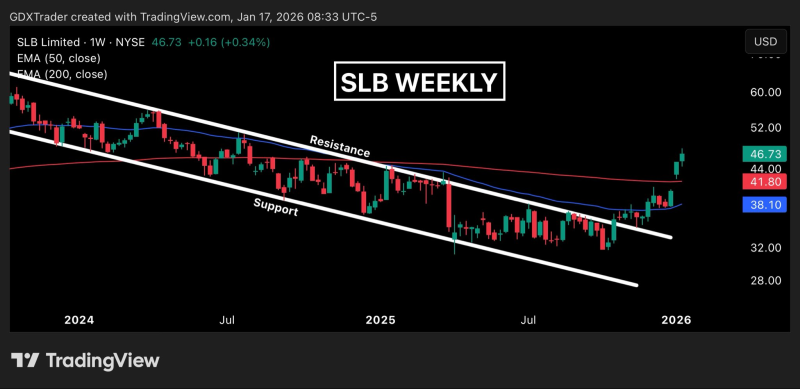
⬤ Here's what stands out: SLB is trading above its 200-week exponential moving average, which traders watch closely for long-term direction. That alone tells you the selling pressure from 2024 has backed off. Even better, the 50-week EMA has flipped upward and is rising underneath price—classic early-stage uptrend behavior. When these moving averages line up like this, it usually means the market's done basing and ready to move higher.
⬤ What's equally important is how the stock's handling pullbacks. Instead of crumbling on dips, SLB keeps forming higher lows, which shows buyers are stepping in consistently. Trading in the mid-to-upper $40s with breathing room above those rising averages, the technical setup looks clean for further upside—assuming momentum holds.
⬤ This matters beyond just one stock. SLB is basically the energy services sector's report card. When it holds above major long-term support and keeps building higher lows, that kind of strength tends to lift sentiment across the whole group. The weekly structure makes it clear: the downtrend pressure is gone, and we're looking at a much healthier market phase right now.
 Peter Smith


