 Usman Salis

⬤ Sirius XM Holdings shares are trading sideways after weeks of consolidation, with recent price action showing uncertainty about where the stock heads next. The daily chart shows Sirius XM closing near $20.50 after a modest decline, with trading volume staying relatively normal. Market watchers are keeping an eye on where SIRI might land over the coming year as the stock remains technically squeezed between support and resistance.
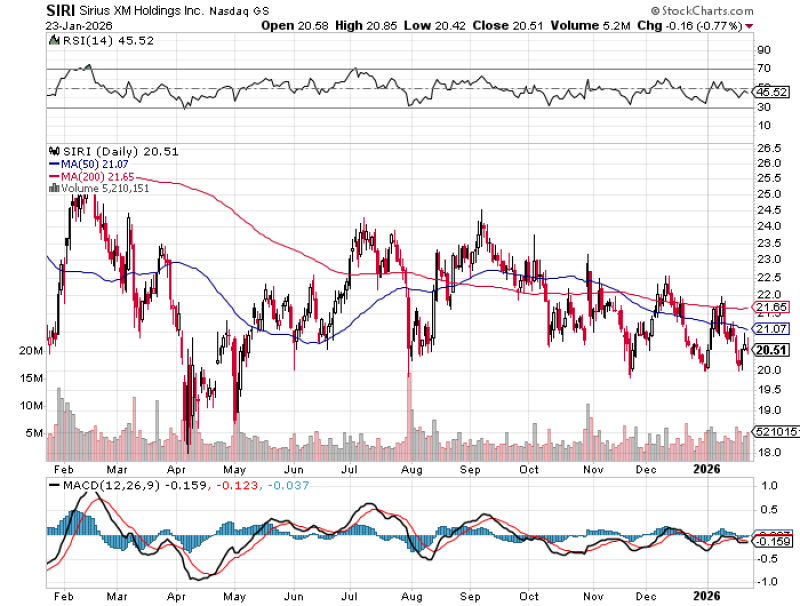
⬤ From a technical standpoint, SIRI is trading below its 200-day moving average near $21.65 and hovering close to its 50-day moving average around $21.07. These moving averages have worked as stubborn resistance over recent months, capping rally attempts and keeping the stock in a sideways pattern. Since late summer, the stock has struggled to hold any meaningful moves above these levels, showing that buyers haven't stepped in with conviction yet. Still, price continues to hold above recent lows, which means sellers aren't exactly piling on either.
⬤ Momentum indicators paint a similar picture of balance. The Relative Strength Index sits in the mid-40s, pointing to neutral conditions rather than oversold or overbought territory. The MACD remains slightly negative but mostly flat, suggesting bearish momentum has cooled off without flipping into a clear bullish signal. Volume patterns show steady participation without signs of panic selling or aggressive buying.
⬤ This technical setup matters because Sirius XM is sitting at a decision point. A sustained move above the 200-day moving average would signal improving trend conditions, while continued rejection at that level could extend the current sideways action. With momentum indicators neutral and price anchored near key technical levels, the stock's next directional move likely depends on shifts in sentiment or company-specific news that provides clearer direction.
 Usman Salis


