 Usman Salis
⬤ PayPal Holdings stock has been stuck in range-bound trading following a rejected upside move late last year. PYPL has been consolidating since 2022 without delivering any sustained trend move during that time. The chart shows price tried to push higher in late 2024, briefly testing the upper consolidation boundary near $93, but the move failed and got slapped back down into the established range.
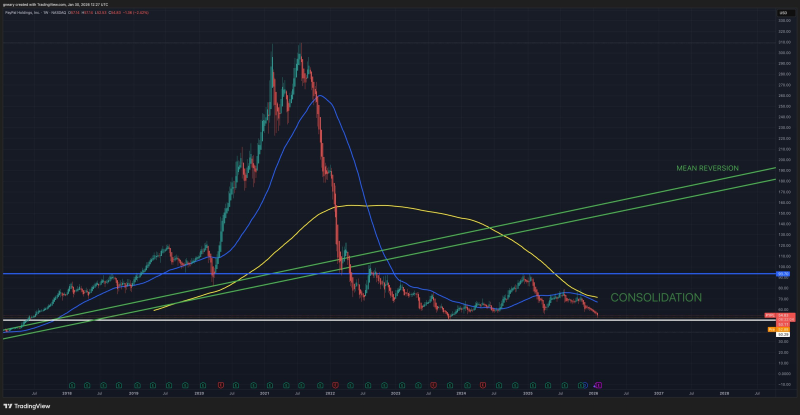
⬤ The longer-term chart tells the story of a strong rally into 2021, followed by a brutal decline and an extended basing phase. Since 2022, PYPL has been bouncing between support in the low $50s and resistance in the low $90s, with multiple failed attempts to print higher highs. The rejection at $93 was the most notable upside test in recent years, but sellers showed up fast, confirming the stock is still locked in consolidation and not ready to transition into a real uptrend.
⬤ Several long-term technical markers are visible, including the 200-week weighted moving average, which continues sloping downward and capping price action. PYPL sits below this average, reinforcing the consolidation setup. A rising long-term trendline and a projected mean reversion path are also mapped out, extending toward the $180 region—though that's being presented as a potential long-term scenario rather than something actionable right now.
⬤ This extended consolidation matters for the broader market because PayPal has historically been a major name in digital payments. The stock's failure to reclaim long-term trend support—even during periods of wider market strength—reflects lingering uncertainty around growth expectations and valuation. Until PYPL can reclaim major technical levels and hold momentum, price action will likely stay stuck in range-trading mode rather than breaking out into any directional move.
 Usman Salis


