 Usman Salis

Palantir (PLTR) stock shows promising technical patterns suggesting an imminent price increase, with multiple wave counts pointing to higher targets.
Palantir (PLTR) Primary Wave Analysis Points to Higher Targets
No change to the current analysis for Palantir stock. Price movement is expected to trend higher toward the 0.382 Fibonacci level at $96.47 for sub-minuette a of minor B wave. However, confirmation hasn't been established yet, meaning this could technically still be part of the minor A wave of (4). The analysis maintains focus on several potential wave structures, with the primary count suggesting a continuing wave B formation.
PLTR Technical Indicators Support Bullish Outlook
Both MACD and RSI technical indicators are supporting the bullish outlook for Palantir shares. These momentum indicators align with the wave analysis, strengthening the case that PLTR is preparing for an upside move that could materialize very soon, possibly as early as the next trading session. This technical confluence provides additional validation to the primary wave count scenario.
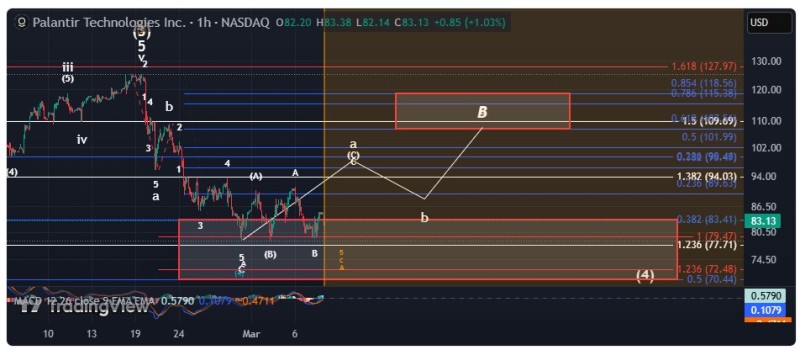
Multiple Palantir (PLTR) Wave Counts Suggest Upward Movement
Three potential outcomes are being tracked for the PLTR stock. The primary expectation is that the stock is currently in wave B with a final target range of $107-$118, or possibly slightly higher, forming a flat abc pattern. The secondary scenario suggests a slight low is needed to complete the minor A wave. The third possibility, considered less likely due to the structure of the recent price movement off the February 28 bottom, is that wave (4) has already concluded, and wave (5) has begun.
Palantir (PLTR) Approaching Critical Inflection Point
It's worth noting that every pattern being tracked has either bottomed or is extremely close to doing so. This convergence suggests that Palantir stock should be headed upside in very short order. The turquoise count, though considered less probable, suggests that wave (4) correction is already complete, and the stock has begun moving higher in wave (5).
The analysis remains confident about an imminent upward move for Palantir shares, with multiple wave counts all pointing to similar conclusions despite slight variations in the exact pattern identification. This technical agreement across different analytical approaches strengthens the case for an upcoming bullish phase.
For investors and traders following Palantir stock, the technical setup suggests preparing for potential upside movement rather than additional significant downward pressure. The multiple wave counts, while differing in specifics, all converge on the expectation of higher prices in the near term.
The flat abc pattern targeted in the primary scenario would take PLTR to the $107-$118 range, representing a significant move from current levels. This projection is based on established wave relationships and Fibonacci extensions that often govern price movements in Elliott Wave analysis.
While the analysis acknowledges some uncertainty regarding which specific wave count is currently playing out, the overall directional bias remains clearly to the upside based on the structure of recent price action and supporting technical indicators.
 Usman Salis


