Marina Lyubimova

⬤ ONDS is approaching a critical technical zone with price preparing to open just under $12 on the higher-timeframe chart. Well-defined boundaries are now guiding whether the current move presents opportunity or signals structural risk. The two-week chart shows ONDS pushing into former resistance territory after a sharp recovery from earlier lows, making price behavior around this level increasingly important.
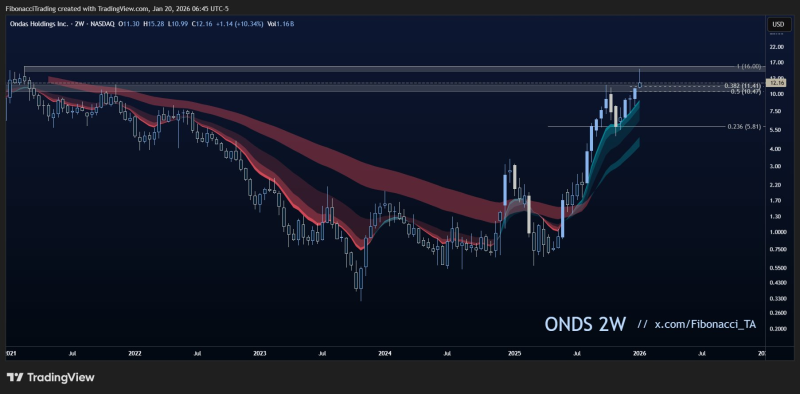
⬤ The chart reveals a clear shift from an extended downtrend into a strong recovery phase. ONDS has reclaimed key moving-average bands and is consolidating above the 0.382–0.5 Fibonacci retracement zone between roughly $11.50 and $10.50. This area represents previously broken resistance that's now potentially acting as support on a retest rather than signaling breakdown. A controlled pullback into this zone would still fit within the broader bullish structure visible on the chart.
A decisive break below approximately $10.45 would mark a change in character and invalidate the current setup.
⬤ Structural risk is clearly marked. Dropping decisively below about $10.45 would indicate the recovery phase has failed and shift the character of this move. Until that level breaks, price action continues showing higher highs and higher lows on the higher timeframe. On the flip side, a sustained push above $16 would represent major expansion, letting ONDS break out of its current range and confirm a fresh leg higher based on the upper Fibonacci projection.
⬤ This moment carries weight because ONDS is now trading where structure—not headlines or short-term noise—becomes the deciding factor. Clearly marked support and resistance levels help separate routine consolidation from actual trend failure. With price sitting just below $12, upcoming action should clarify whether ONDS stabilizes for continuation or revisits lower support before making its next directional move.
 Marina Lyubimova