Usman Salis

⬤ Nvidia shares are consolidating beneath a clearly defined resistance zone near $196 while defending rising trendline support on the weekly chart, with buyers consistently stepping in on pullbacks as price compresses under the same ceiling.
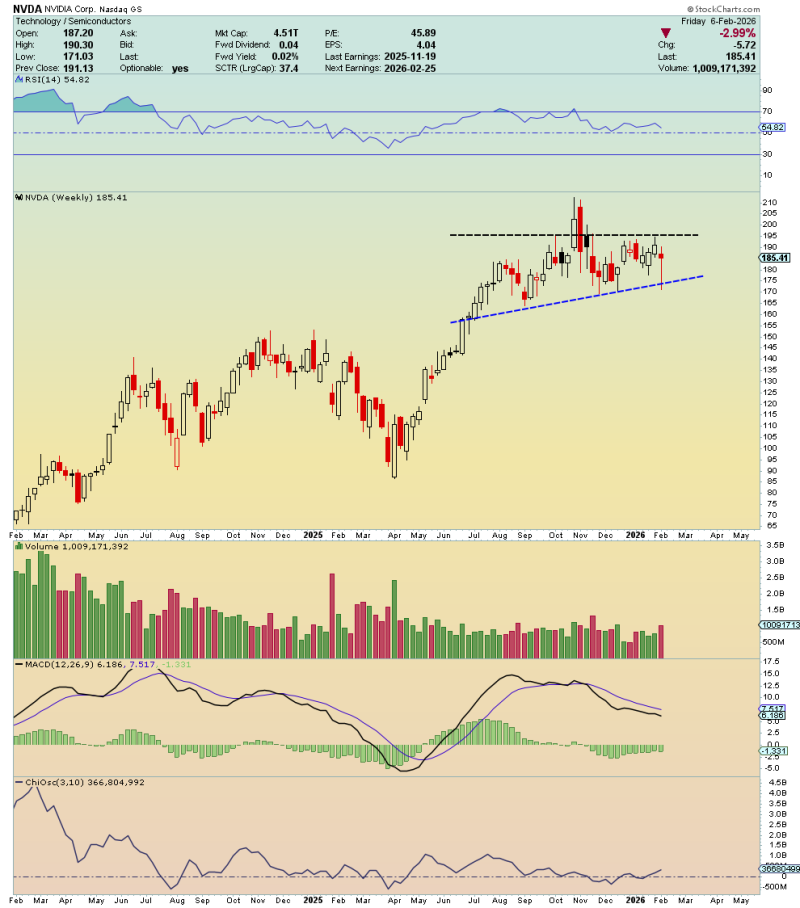
⬤ The chart shows NVDA trading in the mid-$180s after a mild pullback to its rising support line, forming an ascending triangle where higher lows meet flat resistance at $196—a pattern that typically signals accumulation as demand builds beneath stubborn supply.
⬤ "A breakout above $196 could rapidly expand volatility," with speculation around potential company catalysts that might accelerate price movement and trigger a sharp upside reaction if resistance breaks decisively.
⬤ This $196 level matters beyond NVDA itself—as a leadership name in semiconductors and growth sectors, a sustained breakout would confirm broader tech strength, while continued rejection would keep markets locked in consolidation near current highs.
 Usman Salis