Peter Smith

⬤ Nvidia shares held steady this week after testing support at the lower edge of a rising wedge on the weekly chart. The stock consolidated near the upper $180s while respecting the wedge structure. This support hold keeps Nvidia positioned to potentially lead one more rally phase before any broader market pullback.
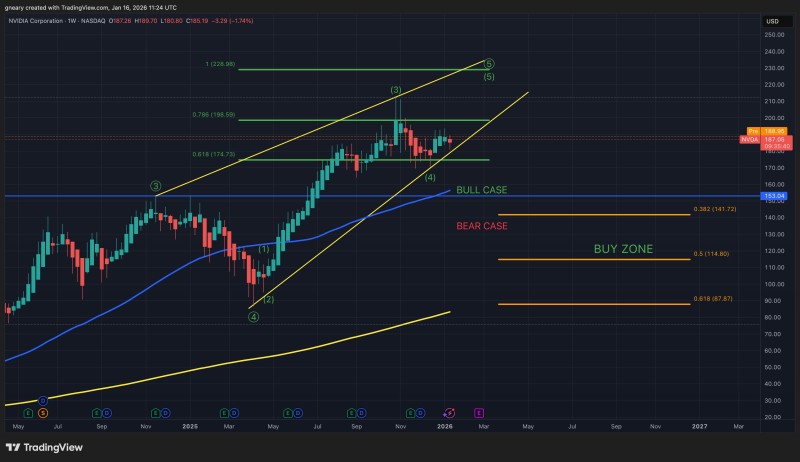
⬤ The weekly chart shows a well-defined rising wedge that's been guiding NVDA's movement throughout its recent run. Price pulled back toward the lower trendline, then stabilized instead of breaking down. That means buyers stepped in at a technically important spot, keeping the pattern alive.
⬤ One standout detail: the 200-week weighted moving average lines up almost perfectly with the 0.618 Fibonacci retracement level. That creates a solid long-term support zone that's been holding up well. NVDA stays above this area, which reinforces its role as a structural foundation. The chart maps out both bull and bear scenarios, and right now price action still favors the bulls as long as support holds.
⬤ Nvidia drives a lot of what happens in tech and the broader market. Holding this rising wedge support and staying above key long-term levels keeps the current trend structure intact. As long as the pattern holds, NVDA's price action will keep shaping expectations around market direction, and any break or bounce from here will likely ripple across sentiment and trend momentum.
 Peter Smith