 Usman Salis
⬤ Nvidia shares bounced back above the 50-day moving average at $186.51 after weeks of choppy price action. The stock closed at $188.85 on June 2, 2026, gaining 1.26%, and traders are eyeing a move toward $195-$200 in the coming sessions.
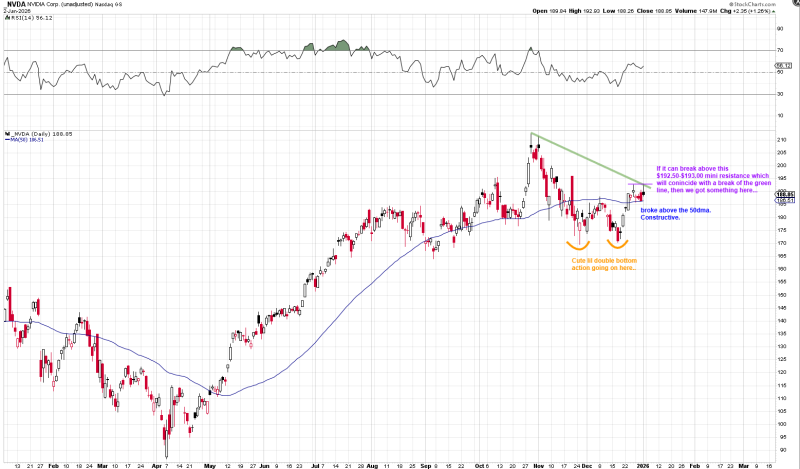
⬤ The chart shows a double bottom pattern near December's lows in the mid-$170s, where the stock found support twice before trending higher. A downward-sloping trendline from prior highs is creating resistance, with a key zone between $192.50-$193.00. Breaking through this area could signal further upside momentum, while the RSI reading of 56.12 suggests balanced momentum after the recent recovery.
⬤ After an extended rally, Nvidia went through several months of volatility and pulled back before stabilizing around its 50-day average. Moving back above that level puts NVDA in the middle of its current trading range. The stock needs to push past the resistance band and break the descending trendline to confirm continued strength.
⬤ The setup is significant because Nvidia remains one of the most watched semiconductor stocks globally. Technical moves around widely followed levels like the 50-day average often influence broader market sentiment. With NVDA now testing resistance while holding above its moving average, traders are watching whether momentum carries the stock toward $195-$200 or if consolidation continues below current levels.
 Usman Salis


