 Victoria Bazir
NVIDIA's impressive rally is entering a decisive technical phase as the stock tests the upper boundaries of its long-term channel. While the overall structure remains bullish, recent indicators point to weakening momentum after years of extraordinary gains. This analysis examines why the current wave may be reaching its limits and what that could mean for tech investors.
Wave 5 Approaching Critical Resistance
A recent technical breakdown by The Long Investor shows NVDA hasn't topped yet, but its upside potential in this Elliott Wave cycle appears increasingly constrained. The weekly chart reveals a textbook fifth-wave formation with the stock trading around $182 and eyeing the 0.786 Fibonacci level near $198—a zone where extended uptrends often lose steam. The pattern forms a rising wedge with converging trendlines that have guided price action since 2023, and that upper boundary now sits between $198 and $229, exactly where resistance is expected to bite.
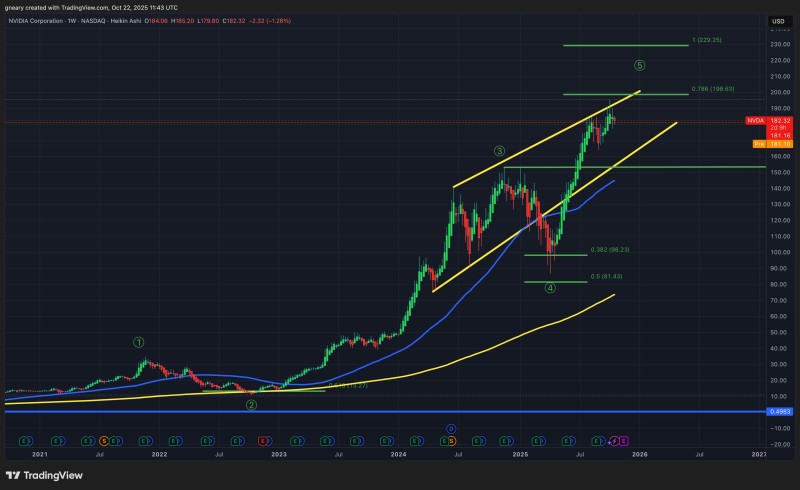
The 50-week and 200-week moving averages continue climbing, confirming NVDA's market dominance. But when price pushes this close to technical extremes, volatility typically follows as traders start locking in profits. Wave 4's correction found a bottom near $81, setting the stage for this final push higher. Based on Fibonacci targets, that $198–$229 range looks like the natural endpoint before things cool off. A weekly close under $175 would likely mark the start of consolidation, with meaningful support around $150 where prior accumulation occurred and mid-channel structure holds.
Why Even the Strongest Names Aren't Immune
The trader made a pointed observation about market vulnerability: "NVDA is one of the strongest companies in the market and managed to drop from $153 to $86 over the last 12 months before recovering. If this can happen to NVDA, it can happen to your zero-revenue hype positions." That's not just a cautionary tale—it's a reminder that NVIDIA's movements often reflect broader market psychology. When NVDA climbs, risk appetite spreads across growth stocks. When it stumbles, capital rushes toward safety. As a massive weight in both the NASDAQ and S&P 500, its direction carries real consequences for portfolio performance.
Implications for the Broader Tech Market
NVIDIA's leadership in AI chips makes it a proxy for sentiment across megacap tech. Its surge has lifted confidence throughout the sector, but exhaustion here could trigger rotation, especially if investors start questioning valuations. The analysis notes that "when NVDA starts its decline, the Tech Mega Caps will follow," highlighting how dependent index strength has become on a handful of dominant names. While NVDA's fundamentals remain exceptionally strong—powered by surging AI chip demand and record data center revenues—the technical setup suggests near-term fatigue, particularly given seasonal patterns.
 Victoria Bazir


