 Usman Salis

⬤ Oracle shares are sitting near $195 after sliding down from their October peak above $300. The stock has been in retreat mode through November and December, losing steam after hitting earlier highs. According to updated LEAF insights and AI swing trading forecasts, Oracle is now catching eyes as traders try to figure out what comes next.
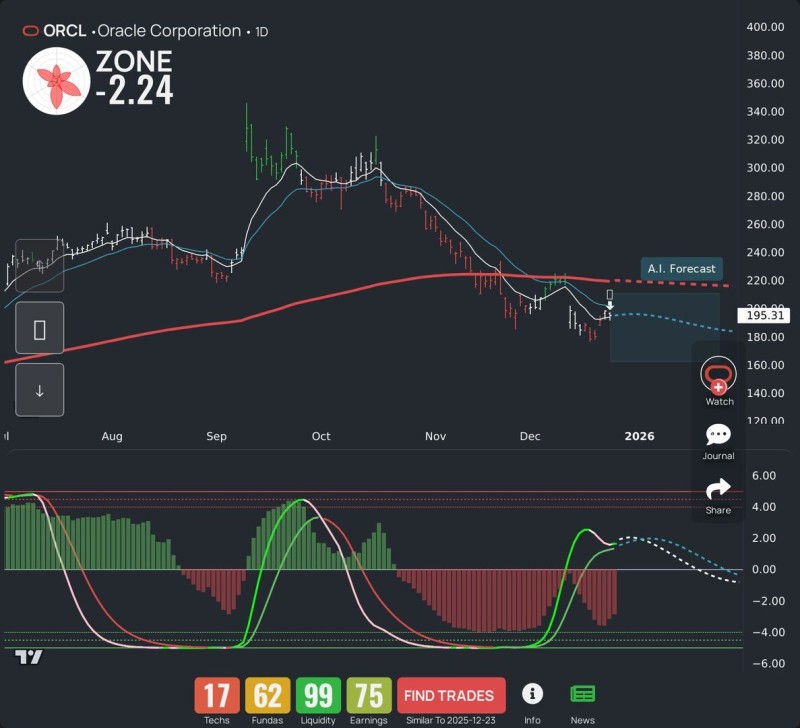
⬤ The chart shows ORCL finding some footing after dipping to around $180, with recent price action hinting at a small bounce. But the stock is still trading well below a key long-term average near $220—that red trend line on the chart has been acting like a ceiling lately. The AI forecast overlay suggests the stock might just chop around sideways for now instead of making any big moves in either direction.
⬤ Momentum indicators show the selling pressure has backed off a bit. The histogram at the bottom is shrinking from its deeper negative levels, and the signal lines are starting to curve upward—though nothing's confirmed yet. Overall, Oracle's chart looks like a stock stuck in consolidation mode within a bigger downtrend, still trading way below support levels that broke during the sell-off.
⬤ This matters because it reflects where big-tech sentiment is right now. Oracle can't seem to break above resistance, but it's also managing to hold recent lows. That's classic indecision territory. The fact that AI forecasts are being used to map out possible price ranges shows how data-driven tools are becoming standard during choppy markets. Where ORCL goes from here could set the tone for other tech names looking for direction.
 Usman Salis


