 Marina Lyubimova
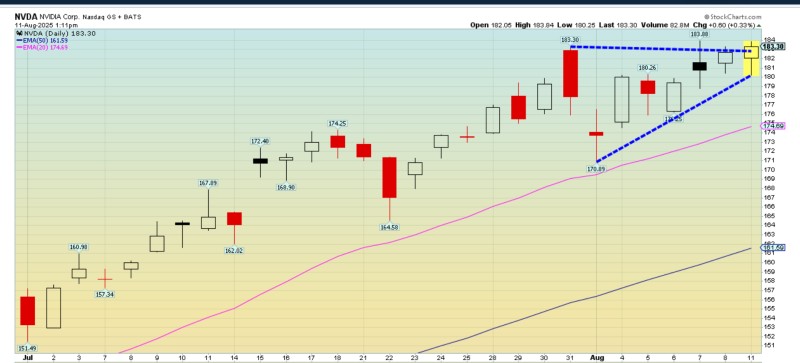
NVIDIA's stock is dancing around a crucial inflection point that could determine its next major move. The chip giant has been building a textbook flat top triangle pattern, and traders are watching closely to see if buyers can finally punch through the stubborn $184 ceiling.
NVDA Price Action Shows Classic Breakout Setup
Trading at $183.30 on August 11, NVDA sits tantalizingly close to its $184 resistance after climbing from the $170.89 low earlier this month. The stock's recent behavior screams "coiled spring" – each bounce off support creates a higher low while that $184 level keeps rejecting upside attempts.
This isn't just random price movement. The 20-day EMA at $174.69 and 50-day EMA at $161.59 are both providing solid support, creating a technical foundation that could launch NVDA higher if momentum kicks in.
$200 Target Comes Into Focus for NVDA Bulls
Here's where it gets interesting: if NVDA finally breaks above $184 with conviction, the next logical target sits at the psychological $200 level. That's not just wishful thinking – it's where technical projections and round-number psychology converge.
But let's be real about the risks. If this breakout attempt fails, NVDA could easily slip back to $175 support or even retest that $170.89 low. Triangle patterns work both ways, and a breakdown would signal the bulls aren't ready yet.
The semiconductor sector's recent strength adds fuel to the bullish case, but ultimately it comes down to whether buyers can show up with enough force to crack this resistance. With NVDA's next earnings catalyst still weeks away, this breakout attempt will be purely technical – making it even more significant if it succeeds.
 Marina Lyubimova


