 Saad Ullah

⬤ The U.S. Dollar Index just broke below a long-term support structure on the monthly chart that's been in play for decades. The index is now trading around the mid-90s after getting rejected at the upper boundary of its massive descending channel. This isn't just any support line—it's one that's marked turning points in global currency flows for years.
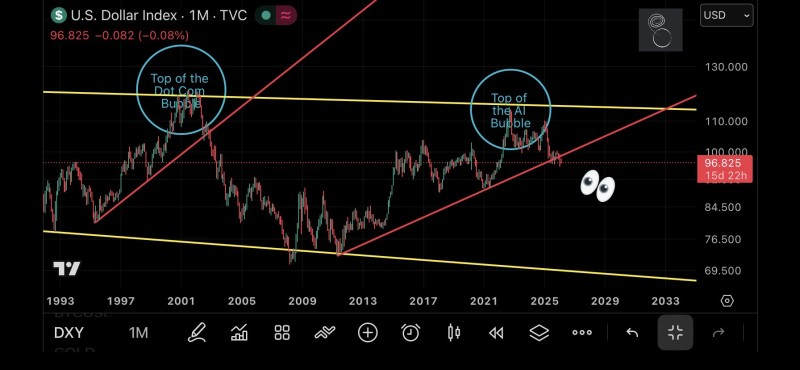
⬤ Here's where it gets interesting: we've seen this movie before. Back around 2000, the DXY rolled over from the top of this same channel, then lost major support in 2002. The current setup looks eerily similar. The dollar peaked in 2022, weakened throughout 2023-2024, and now it's punched through that critical floor again.
⬤ The chart shows two clear peaks near the channel's resistance—both marked as macro tops—followed by steep drops toward lower support. Right now, the DXY is sitting back in that historical 95-100 range where it's found footing before. Other market watchers have been calling out the ongoing dollar weakness and the pressure building at these critical support zones too.
⬤ Why does this matter? The DXY measures the dollar against a basket of major currencies, and when it moves, everything else feels it—commodities, global stocks, emerging markets, you name it. A sustained break below this structural support could signal we're entering a whole new phase in currency dynamics. If the 2000s pattern plays out again, we might be looking at years of dollar weakness ahead, which would reshape capital flows across the entire financial system.
 Saad Ullah


