 Sergey Diakov
Nvidia is at a crossroads. The stock is trading right around $167, a level that analysts say is as significant as the NASDAQ 22K reference point. As long as price holds here, the structure looks intact. If it breaks, things can shift fast.
$167 Is the Level Every Trader Is Watching
According to analyst The Great Martis, the $167 zone is a critical anchor for the current market structure. The chart shows a broadening pattern forming after a strong multi-year uptrend, with price consolidating following an earlier overshoot.
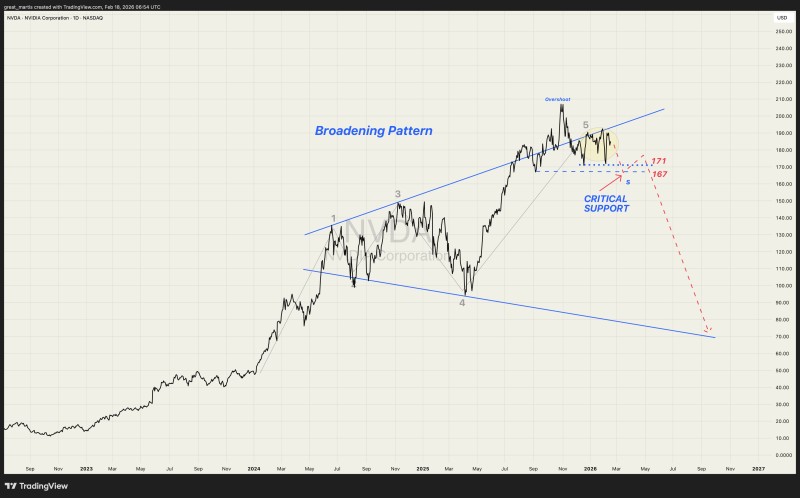
Reference points cluster around 171 and 167, and the setup is considered "safe" while price stays above that floor. This lines up with what multiple analysts have flagged as NVDA and Nasdaq charts showing warning signs at critical $167 resistance, and the picture only sharpens when you look at NVDA testing critical support near the $167 area - all pointing to the mid-$160s as a key technical inflection point.
The structure is safe while price holds above the level - but if $167 is breached, the technical picture can deteriorate quickly due to how widely the level is being watched.
A Break Below $167 Could Trigger a Broader Shift
The reason $167 matters so much comes down to visibility. Because the level is so widely watched, a break would not just be a chart event - it risks triggering a sharp shift in positioning as traders react to failed support. This concern is well documented in the NVDA critical support zone around $166, reinforcing just how much weight the mid-$160s carry for the broader setup. Given Nvidia's role as a market leader, that kind of move could feed into broader sentiment quickly, flipping the narrative from controlled consolidation to invalidation risk in short order.
For now, NVDA is at a level where market attention itself becomes part of the setup. Holding above $167 keeps the consolidation within the broader pattern. Losing it changes the story entirely.
 Sergey Diakov


