 Saad Ullah
⬤ Nvidia (NVDA) keeps bumping up against resistance on the monthly chart, with traders still eyeing that chunky bearish engulfing candle that showed up in November. The pattern's still getting respect as a warning flag while price stays pinned below the upper band. NVDA last closed around $188.85 on the monthly after clawing back from late 2025 weakness, but that November candle hasn't gone anywhere in traders' minds.
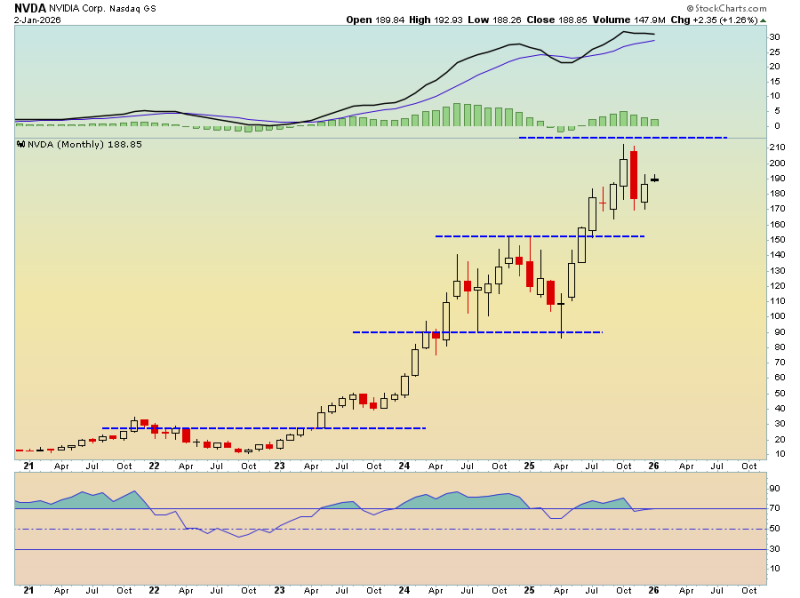
⬤ The chart tells the story of Nvidia's monster multi-year run, dotted with consolidation zones and breakout areas marked by horizontal levels. What makes the November candle interesting is how it swallowed the month before while forming right near resistance between $210 and $215. A solid break above roughly $208 would likely kill the pattern from a technical view and ease worries about more downside. Monthly momentum indicators show things cooling off after the extended climb, though they're still sitting in positive territory.
⬤ Nvidia (NVDA) has been the stock everyone's watching through the AI chip boom, and its chart setup keeps sparking conversation. The annotated view shows shares holding above prior support near the mid-$160s after recent chop. Beyond the technicals, eyes are also on Nvidia CEO Jensen Huang's Monday appearance. Traders typically hang on these events for clues about demand, product roadmap, and where the sector's headed next.
⬤ The ongoing focus on Nvidia's monthly pattern shows how much weight technical signals carry in shaping near-term views on big growth names. With NVDA still trading beneath that resistance zone, sentiment partly hinges on whether the stock can spark fresh upside or if November's formation keeps acting as a ceiling. Given Nvidia's anchor role in AI and chip markets, how NVDA trades can ripple out into broader tech and equity market risk appetite.
 Saad Ullah


