 Usman Salis

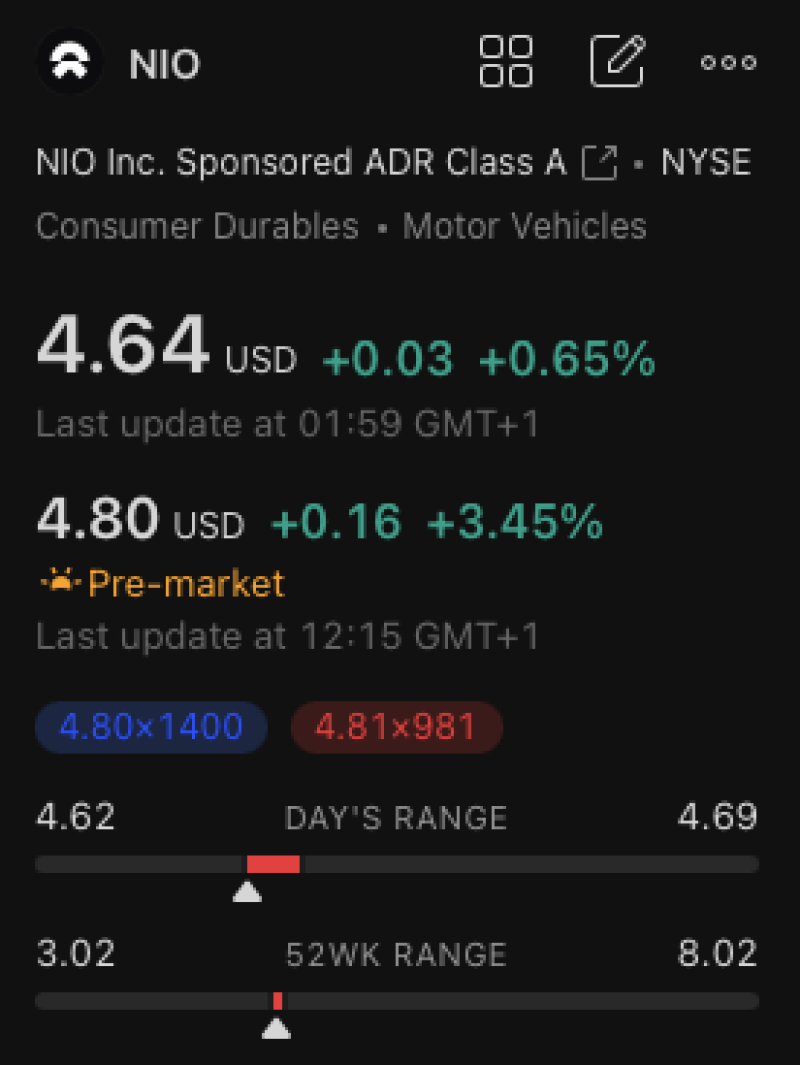
⬤ NIO Inc. shares climbed toward a technically significant zone near $4.91, catching the attention of traders watching for signs of a potential shift in momentum. The stock is now testing an important Fibonacci level that has blocked upside movement in recent sessions. Pre-market data shows NIO trading close to this threshold, raising questions about whether it can hold above this mark by the session's end.
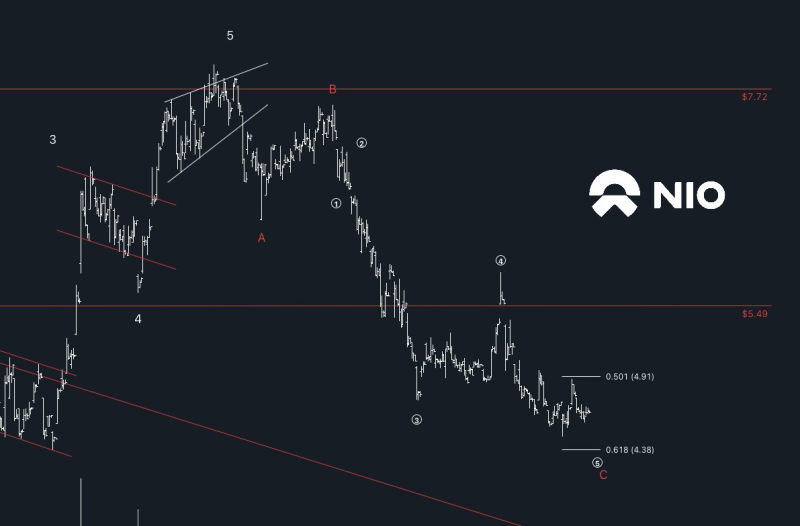
⬤ The $4.91 level stands out as a pivotal resistance zone, marked by Fibonacci retracement alignment and previous price reactions. This area represents a key decision point where sustained strength could signal the beginning of a new impulsive move. Until that level is clearly broken and held, NIO remains technically stuck within a broader corrective pattern.
This level represents a clear technical boundary—acceptance above $4.91 would materially change the short-term outlook.
⬤ If NIO manages to break convincingly above $4.91, higher reference levels would come into play, including historical resistance near $5.49 and a prior minor wave high around $5.79. However, NIO is known for sharp and volatile swings around major technical zones, making the daily close particularly important for confirming which direction the stock is heading. With NIO trading near the lower portion of its multi-year range, how the market responds at this level could influence near-term momentum and broader sentiment toward the stock.
 Usman Salis


