Usman Salis

⬤ NIO keeps dropping as it reaches a price band that traders have watched for weeks. While the share traded above seven dollars, many ignored the warnings - yet the chart now shows a clear picture. The price has arrived at a level where the 0.618 Fibonacci retracement and the 200-day moving average meet and that level may decide the next step.
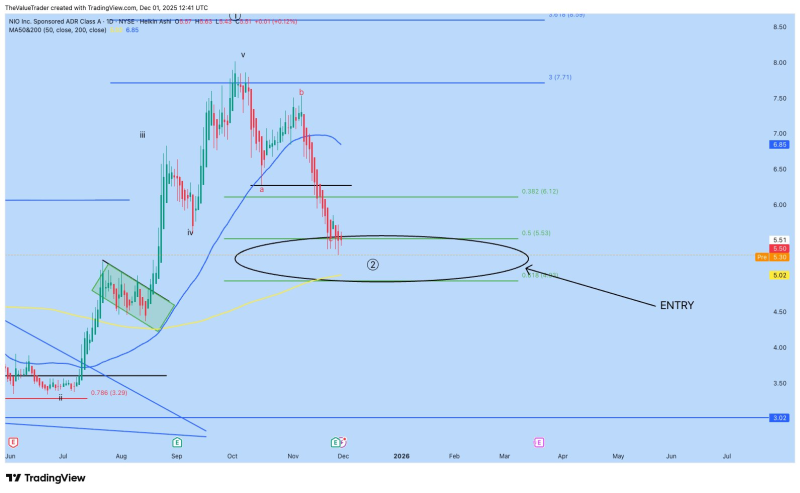
⬤ The chart shows that NIO finished a five wave rise which topped near 7.70 then turned downward. Through November the fall sped up, cut through the 6.12 level (the 0.382 Fibonacci) and headed toward 5.53 at the 0.5 retracement. Right now the focus is on the 5.02 mark - the 0.618 retracement - the share is moving into the wide support band drawn on the chart. Many of the late summer gains have already disappeared as NIO keeps sliding into this cluster.
⬤ The 200-day average carries weight here because it lies exactly where those Fibonacci levels sit - the zone gains extra importance. Pre-market trading placed NIO near 5.30, which sets it inside the middle of this marked area. Earlier cautions to watch those levels drew little notice - yet the present decline has parked the share precisely where forecast. The open question is whether buyers appear and reverse the move from this point.
⬤ NIO's action inside this band may speak for the direction of the EV sector. A clean bounce from this support cluster would steady the trend into early 2025. A fall under 5.02 would point to deeper trouble. The outcome at this crossing of moving average besides Fibonacci levels will probably set the mood for momentum and for risk appetite across growth oriented EV names.
 Usman Salis