 Usman Salis

⬤ NIO is catching traders' eyes again as its price action forms a recognizable corrective pattern that suggests the stock may be stabilizing after its recent decline. The shares are trading near the mid-$5 range while approaching technical zones that could determine the next directional move. The chart structure shows what appears to be a completed impulse wave higher followed by a classic three-wave pullback.
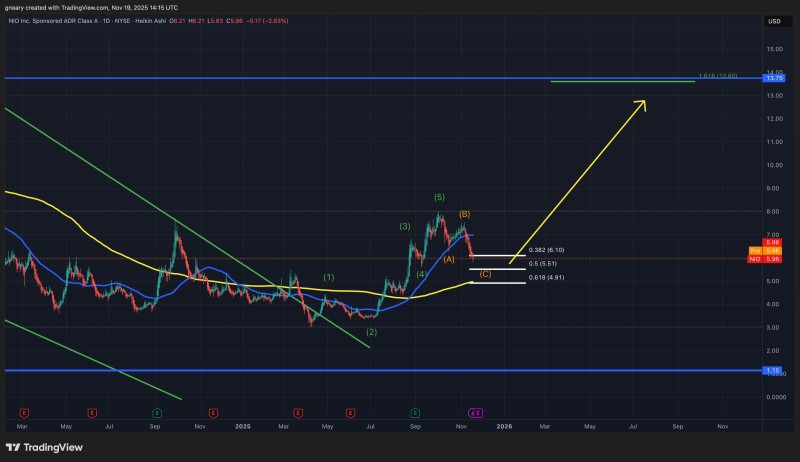
⬤ The technical layout reveals a completed five-wave advance followed by an A–B–C correction, with NIO now testing the 0.382, 0.5, and 0.618 Fibonacci retracement levels at $6.10, $5.51, and $4.91 respectively. These price zones represent areas where buying interest has historically emerged. The corrective structure appears to be maturing, and if support holds at these levels, the stock could be positioned for another leg higher.
⬤ The chart projects a substantial upside target toward the $13.75 to $14.00 area, which aligns with the 1.618 Fibonacci extension marked on the graphic. This projection suggests room for a significant rally if NIO can maintain its structural support and resume its previous uptrend. The wave count and price behavior both support the view that a constructive setup is developing.
⬤ What makes this setup noteworthy is that NIO sits at a decision point where the stock could either continue its trend or face a deeper pullback. The convergence of multiple Fibonacci levels and wave structure highlights why this support zone matters. A bounce from here would signal renewed buying momentum, while a break lower could shift the near-term outlook and test investor confidence in the recovery narrative.
 Usman Salis


