 Usman Salis
⬤ Netflix Inc. (NFLX) is going through a correction phase right now, with the stock pulling back after a strong run higher. Selling volume has been picking up lately, which makes it more likely that the price will keep drifting down toward that 200-week moving average. The momentum that pushed shares higher recently has clearly faded.
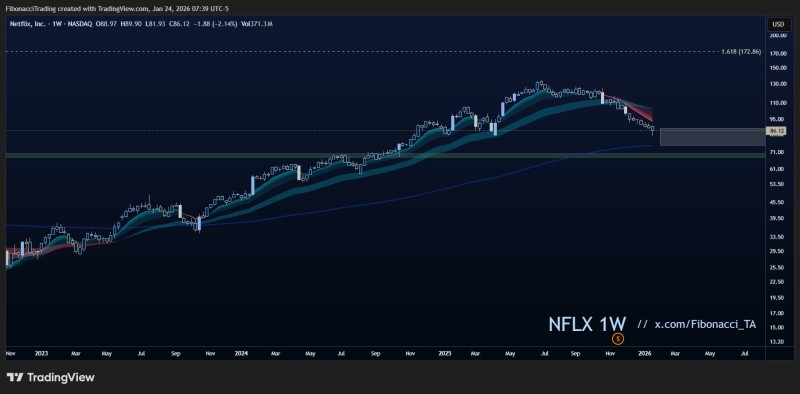
⬤ Looking at the chart, NFLX has dropped from around $130 and is now trading in the mid-$80s range. You can see several weekly candles in a row pointing downward. The stock has broken below the short-term trend support that held it up during the rally, showing that something's shifted in how the market views Netflix right now. The technical indicators are starting to slope down too, which backs up the idea that sellers are in control at the moment.
⬤ The big level everyone's watching is that 200-week moving average sitting near $75. This has been a major support area during past corrections and tends to be where price action gets interesting. There's also a support zone just above this level that the stock might gravitate toward if the selling keeps up. Right now, there aren't any clear signs on the weekly chart that buyers are stepping back in.
⬤ Why this matters: when a stock like Netflix approaches its 200-week moving average, it's testing whether the long-term uptrend is still intact. If the price stabilizes around $75, it could find its footing and bounce back. But if it keeps falling through that level, we're looking at a deeper pullback that could shake confidence in big tech and media stocks more broadly.
 Usman Salis


